
Home Dashboard
Track your marketplace activity, revenue, and time-sensitive deals from the Suger Console Home page.
Overview
The Home dashboard gives you a live view of where your marketplace business stands. It pulls together summary metrics, disbursed revenue, and expiring deals so you can spot momentum and act before anything lapses.
Track Your Summary Metrics
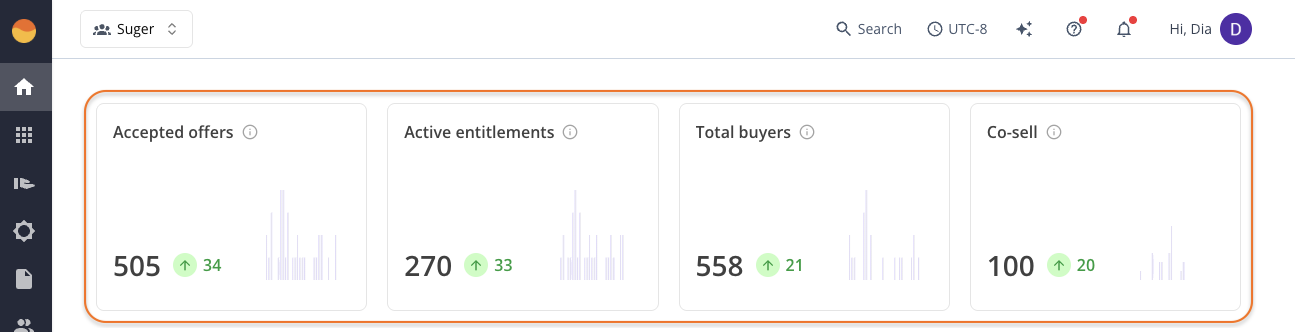
The four summary cards at the top give you a live view of where your marketplace business stands right now. To see how each metric has shifted over the past 30 days, hover over the info icon on any card.
Use these cards together rather than in isolation. Comparing them against each other helps you spot gaps or momentum in your pipeline.
Accepted Offers
This is an all-time total of marketplace offers that buyers have accepted.
If accepted offers are growing but active entitlements aren’t keeping pace, deals may be getting stuck before they go live. Check whether there’s a bottleneck between acceptance and activation.
Active Entitlements
This shows only currently active contracts. It reflects your live customer base at this moment.
If this number flatlines or drops while accepted offers keep climbing, something may be stalling between signing and activation. Bring this to your team’s attention so it doesn’t quietly widen.
Total Buyers
This is the total number of buyer accounts in your workspace. Comparing this against your active entitlements can surface accounts that haven’t converted or are no longer active.
If that gap is widening, it may be worth reviewing whether there are opportunities your team hasn’t followed up on.
Co-Sell
Your current partner-driven activity on the platform. If this number is trending up, make sure your team is following up on those opportunities in a timely manner.
Track Your Disbursed Revenue
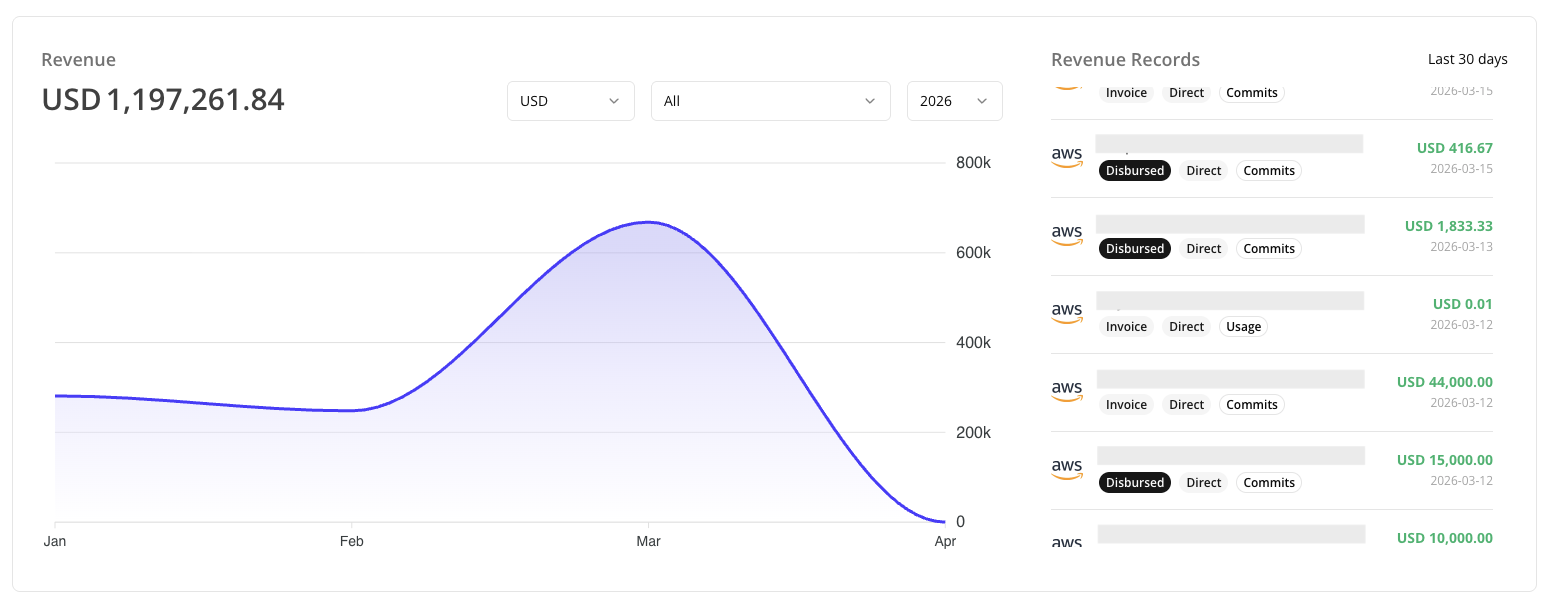
The Revenue section gives you two views of your marketplace earnings:
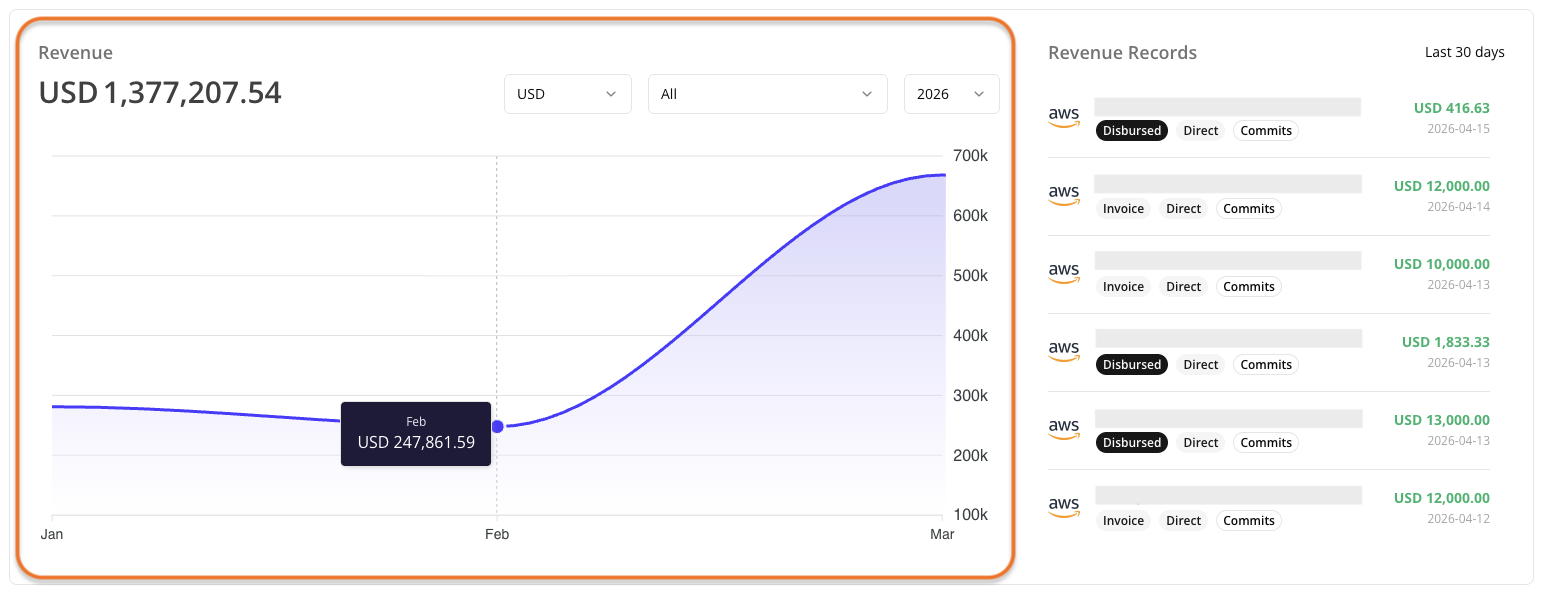
- A trend chart (left) that shows disbursed revenue over time.
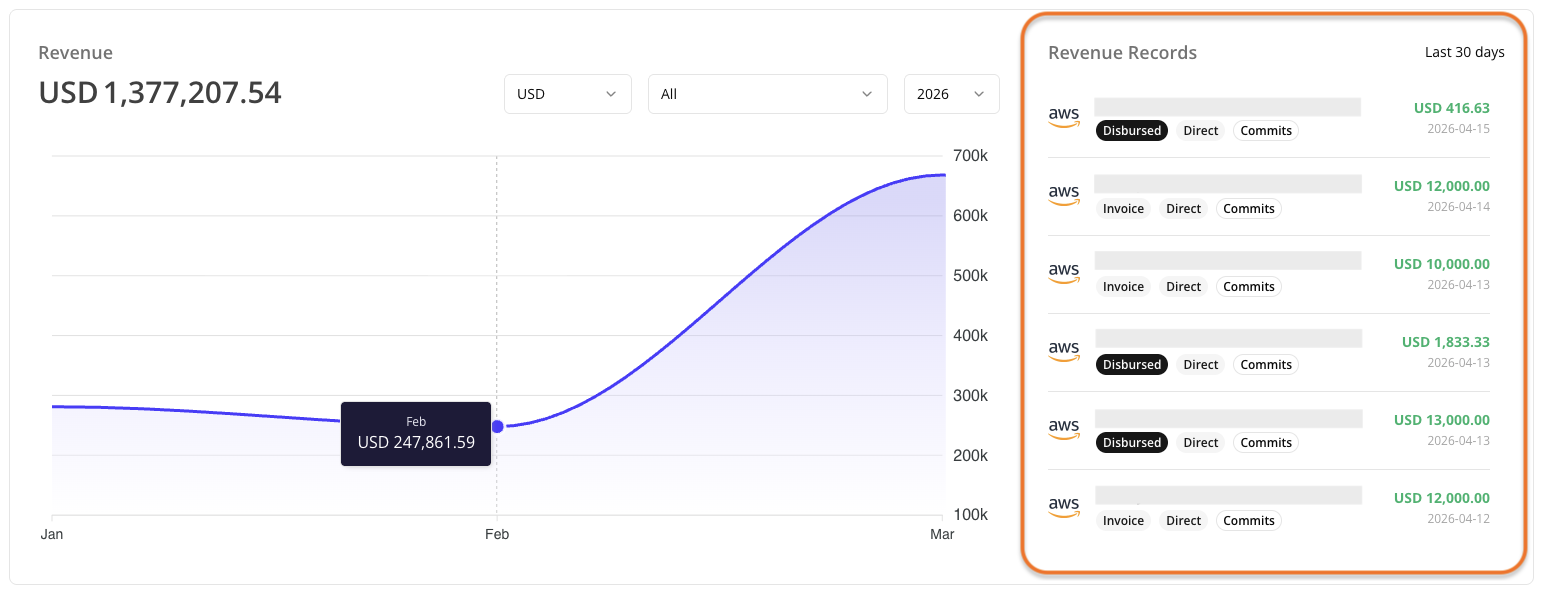
- A feed of recent revenue records (right) showing what’s moved in the last 30 days.
Together, they answer two questions: how much has been paid out to you over time, and what’s been moving recently?
Key terms to know
- Disbursed Revenue: The net cash deposited into your bank account after marketplace fees and deductions. This is what the Revenue chart tracks.
- Invoice Amount: The gross amount billed to the buyer by the cloud provider, before any deductions. Shown in the revenue records.
- Total Contract Value (TCV): The full value of a deal at signing. Tracked separately on the entitlement and not reflected in the revenue chart.
Revenue Trend Chart
The chart displays your total disbursed revenue across all cloud marketplaces for the selected year. Because it only shows deals where disbursement has already occurred, the numbers reflect actual cash paid out to you rather than invoiced amounts or TCV sold.
If a deal is missing from the chart entirely, it means disbursement has not happened yet, even if the buyer has already been invoiced or payment has been collected. Once disbursement is processed, the record will appear.
Use the filters above the Revenue chart to zero in on what you need:
- Currency: Switch between USD and other supported currencies to see disbursements in your preferred denomination.
- Marketplace: Filter by a specific cloud marketplace or keep it set to “All” for a combined view. This is useful when comparing performance across providers or isolating revenue from one cloud.
- Year: Select the disbursement year you want to analyze.
Revenue Records
The panel on the right shows transactions from the last 30 days, giving you a current view of what has been invoiced and disbursed across your marketplace deals.
Each record shows the customer name, invoice amount, invoice date, and a set of badges that describe the transaction. Click any record to open the full deal details and history.
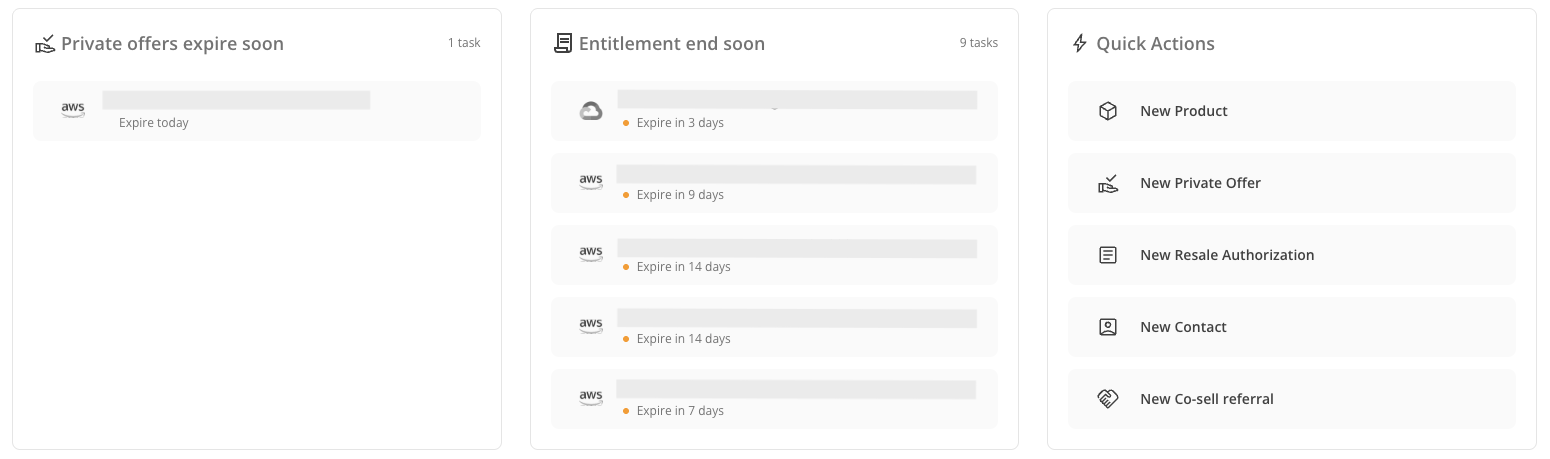
Stay on Top of Expiring Deals
This section surfaces time-sensitive deals so you can act before they lapse, and gives you shortcuts to common workflows.
- Private offers expire soon: Shows private offers approaching their expiration date. Reach out to the buyer to confirm their intent before the offer expires. Click any offer to open the offer page directly, where you can review the details and take action, like extending the offer.
- Entitlements end soon: Shows active marketplace contracts nearing their end date. Use this list to prioritize renewal conversations with your customers before their contract lapses. When you’re ready to renew, click the entitlement to open it directly and initiate the renewal workflow from within Suger.
- Quick actions: Provides direct shortcuts to commonly used workflows to speed up your daily tasks without navigating through multiple menus.
Frequently Asked Questions
Why is my recent disbursement missing from the dashboard?
The dashboard syncs automatically every two hours, so very recent transactions may not appear right away. If you need the latest data immediately, you can trigger a manual sync:
- Go to Settings, then Integrations.
- Find the tile for the cloud marketplace the deal belongs to.
- Click Sync.
If the record still doesn’t appear after syncing, you can also check Revenue > Raw Records for a more granular view of your transaction data.
What does the revenue number on the dashboard represent?
The Home dashboard displays total disbursed revenue (money actually paid out by cloud providers), not invoiced amounts or TCV. This means revenue will only appear after the cloud provider processes and disburses payment.
Timing varies depending on the cloud marketplace, customer payment terms, and contract type. While 30–60 days is a common range, actual time to disbursement can be shorter or longer depending on these factors.
Why is my dashboard showing zero revenue when I know I have sales?
Revenue only appears on the dashboard after disbursement has been processed by the cloud provider. If your deals have been invoiced but disbursement has not occurred yet, it won’t show in the dashboard.
To check the status of a specific transaction before disbursement, go to Revenue > Raw Records.
Why do I see different revenue numbers between the Home dashboard and my product pages?
The Home dashboard shows total disbursed revenue across all products, marketplaces, and time periods. Meanwhile, product pages may show different metrics like invoiced amounts, pending disbursements, or product-specific totals.
My Suger homepage shows different numbers than my AWS/Azure/GCP console. Why?
Cloud provider consoles may show invoiced amounts or different time periods, while Suger’s Home dashboard specifically tracks disbursed revenue.
There can also be a reporting delay between systems depending on your cloud provider’s processing time. If the discrepancy persists after your next sync, reach out to Suger Support for assistance.