Craft Dashboards
Create Charts
Dashboards in Suger Analytics are built using various types of charts. Before designing a dashboard, you’ll need to create and configure charts first. These charts are reusable and can be shared between different dashboards, ensuring that your data visualizations remain consistent and can be easily updated.
Steps to Create a New Chart in Suger Analytics
-
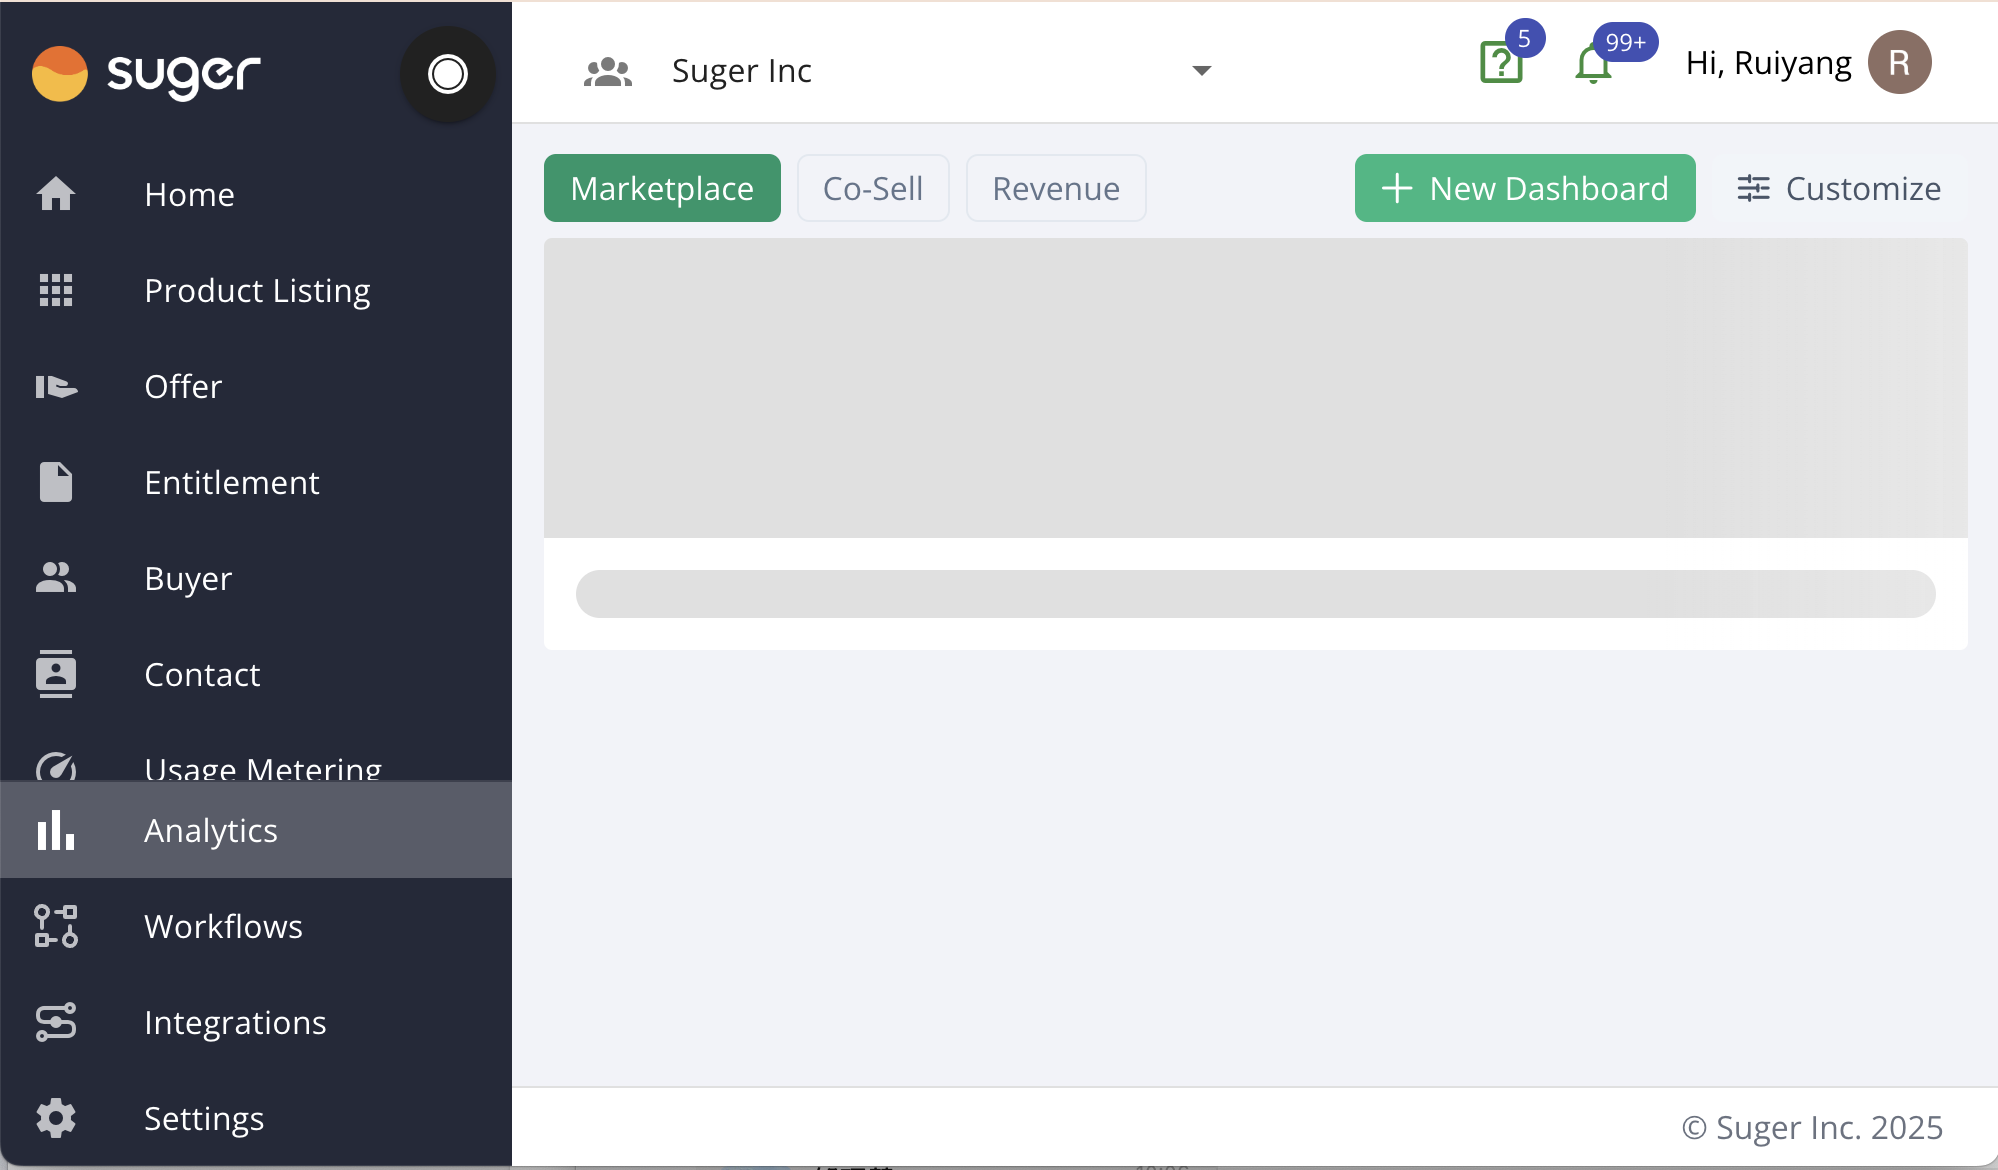
Navigate to Suger Analytics from Console
- Log in to the Suger Console at Suger Console.
- Click the “Analytics” menu item on the left.
- Click “New Dashboard”, which will redirect you to Suger Analytics to start creating charts and dashboards.
-
Create a New Chart
- Navigate to “Charts” by clicking the “Charts” tab in the navigation menu.
- Click the “New Chart” button on the top right corner of the “Charts” page to enter the chart creation wizard.
- Follow the wizard, choosing the appropriate dataset and chart type.
-
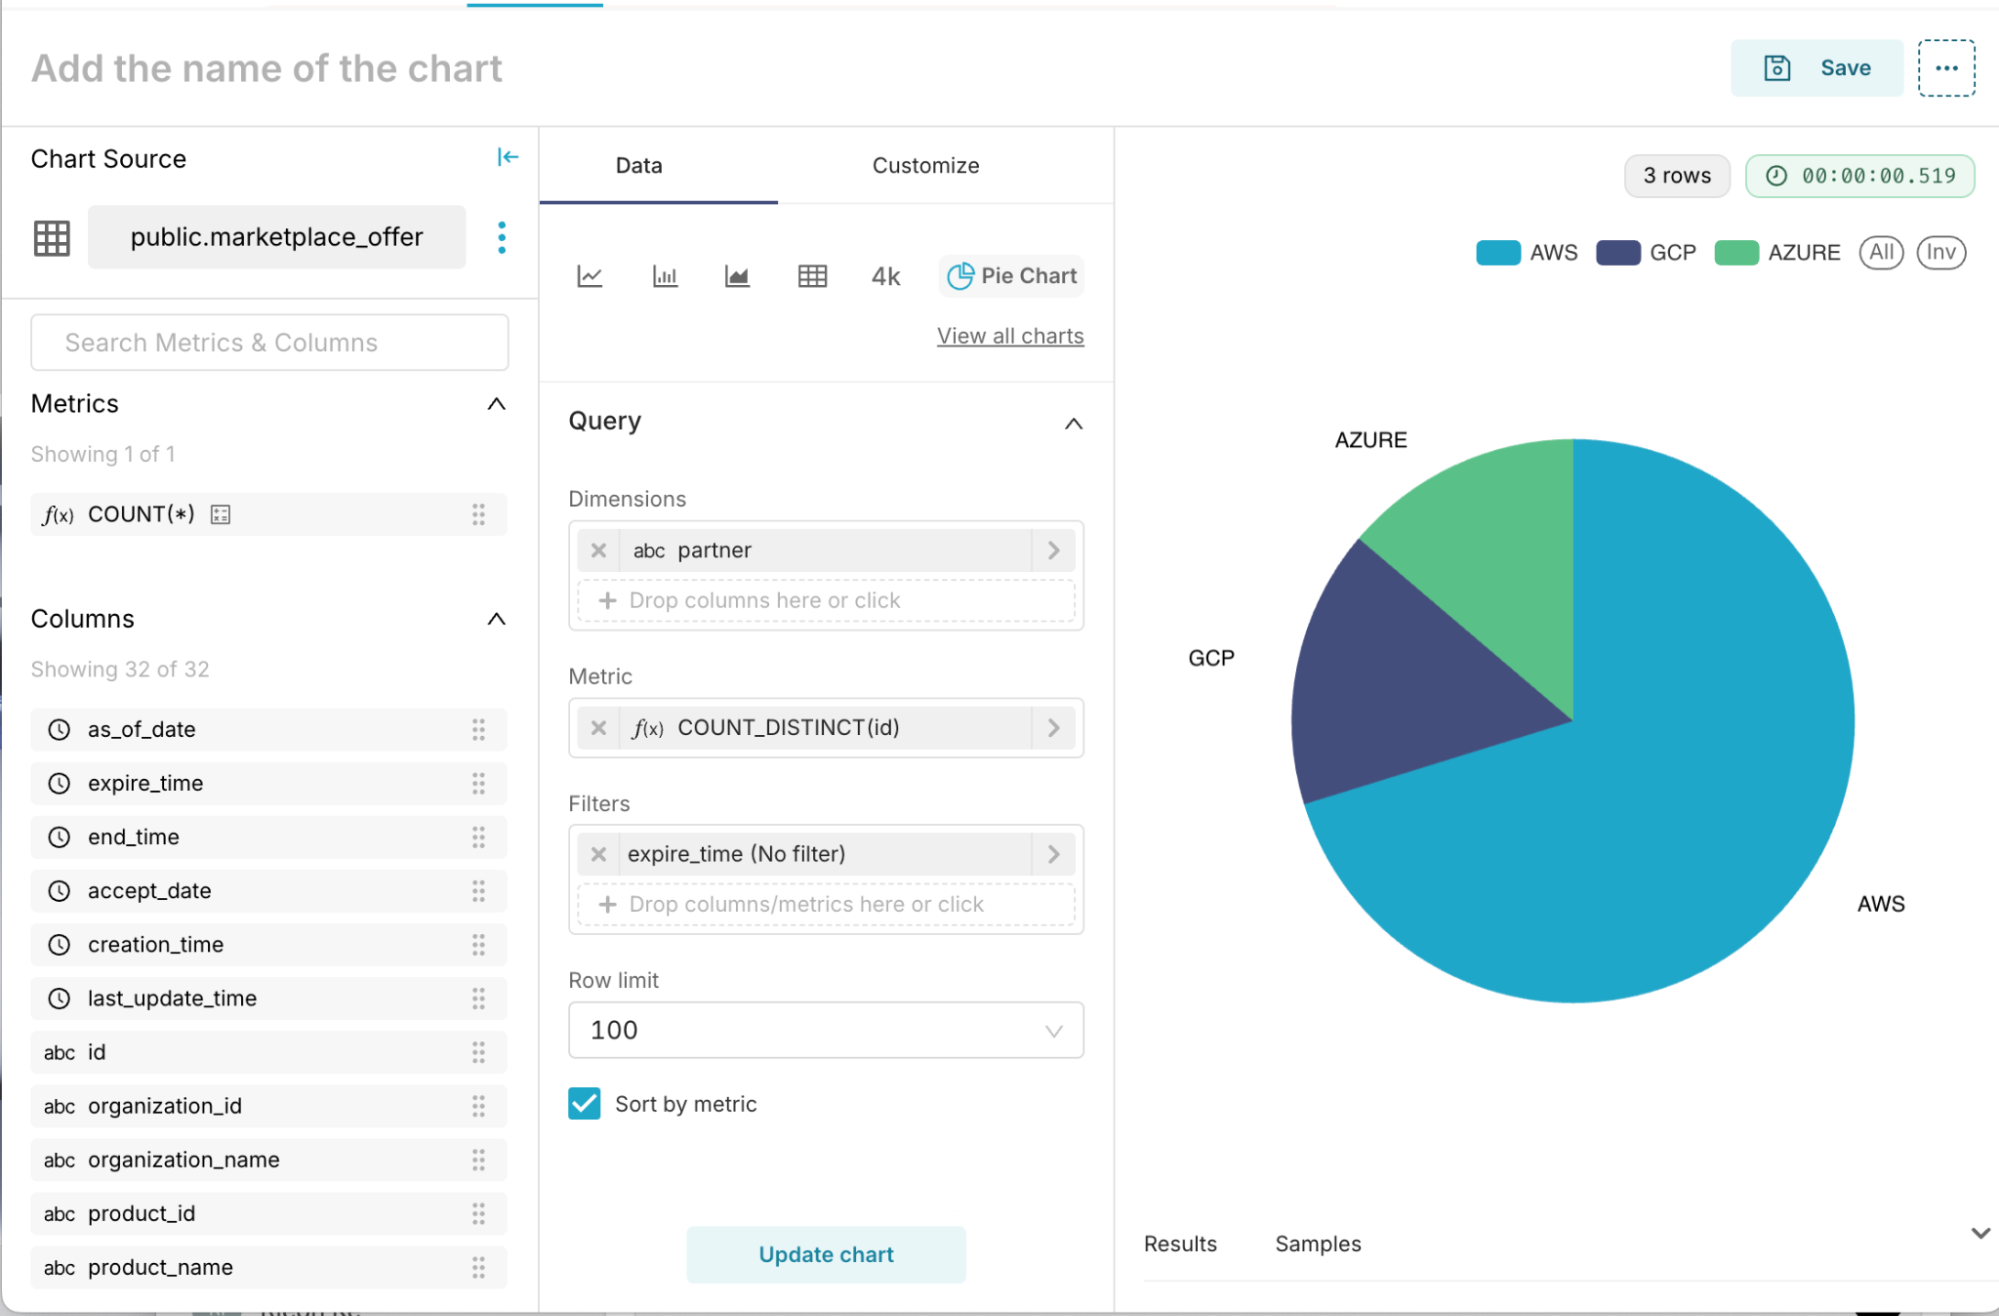
Design Your Chart
- In the chart design page, drag and drop the required metrics and columns into the appropriate data areas (e.g., X-axis, Y-axis, Legend, etc.).
- Customize the chart’s appearance, labels, and other design elements to fit your needs. You can change colors, axis labels, or the chart title to make the chart more informative.
-
Save the Chart
Once you are satisfied with the chart design, click the “Save” button located at the top right corner.
Create Dashboards
Once you’ve prepared your charts, you’re ready to start creating dashboards in Suger Analytics. Dashboards help organize and display multiple charts, metrics, and data visualizations in one place, making it easier to gain insights from various aspects of your business or operations.
Steps to Create a New Dashboard in Suger Analytics
-
Navigate to Suger Analytics from Console
- Log in to the Suger Console at Suger Console.
- Click the “Analytics” menu item on the left.
- Click “New Dashboard” to be redirected to Suger Analytics to create your charts and dashboards.
-
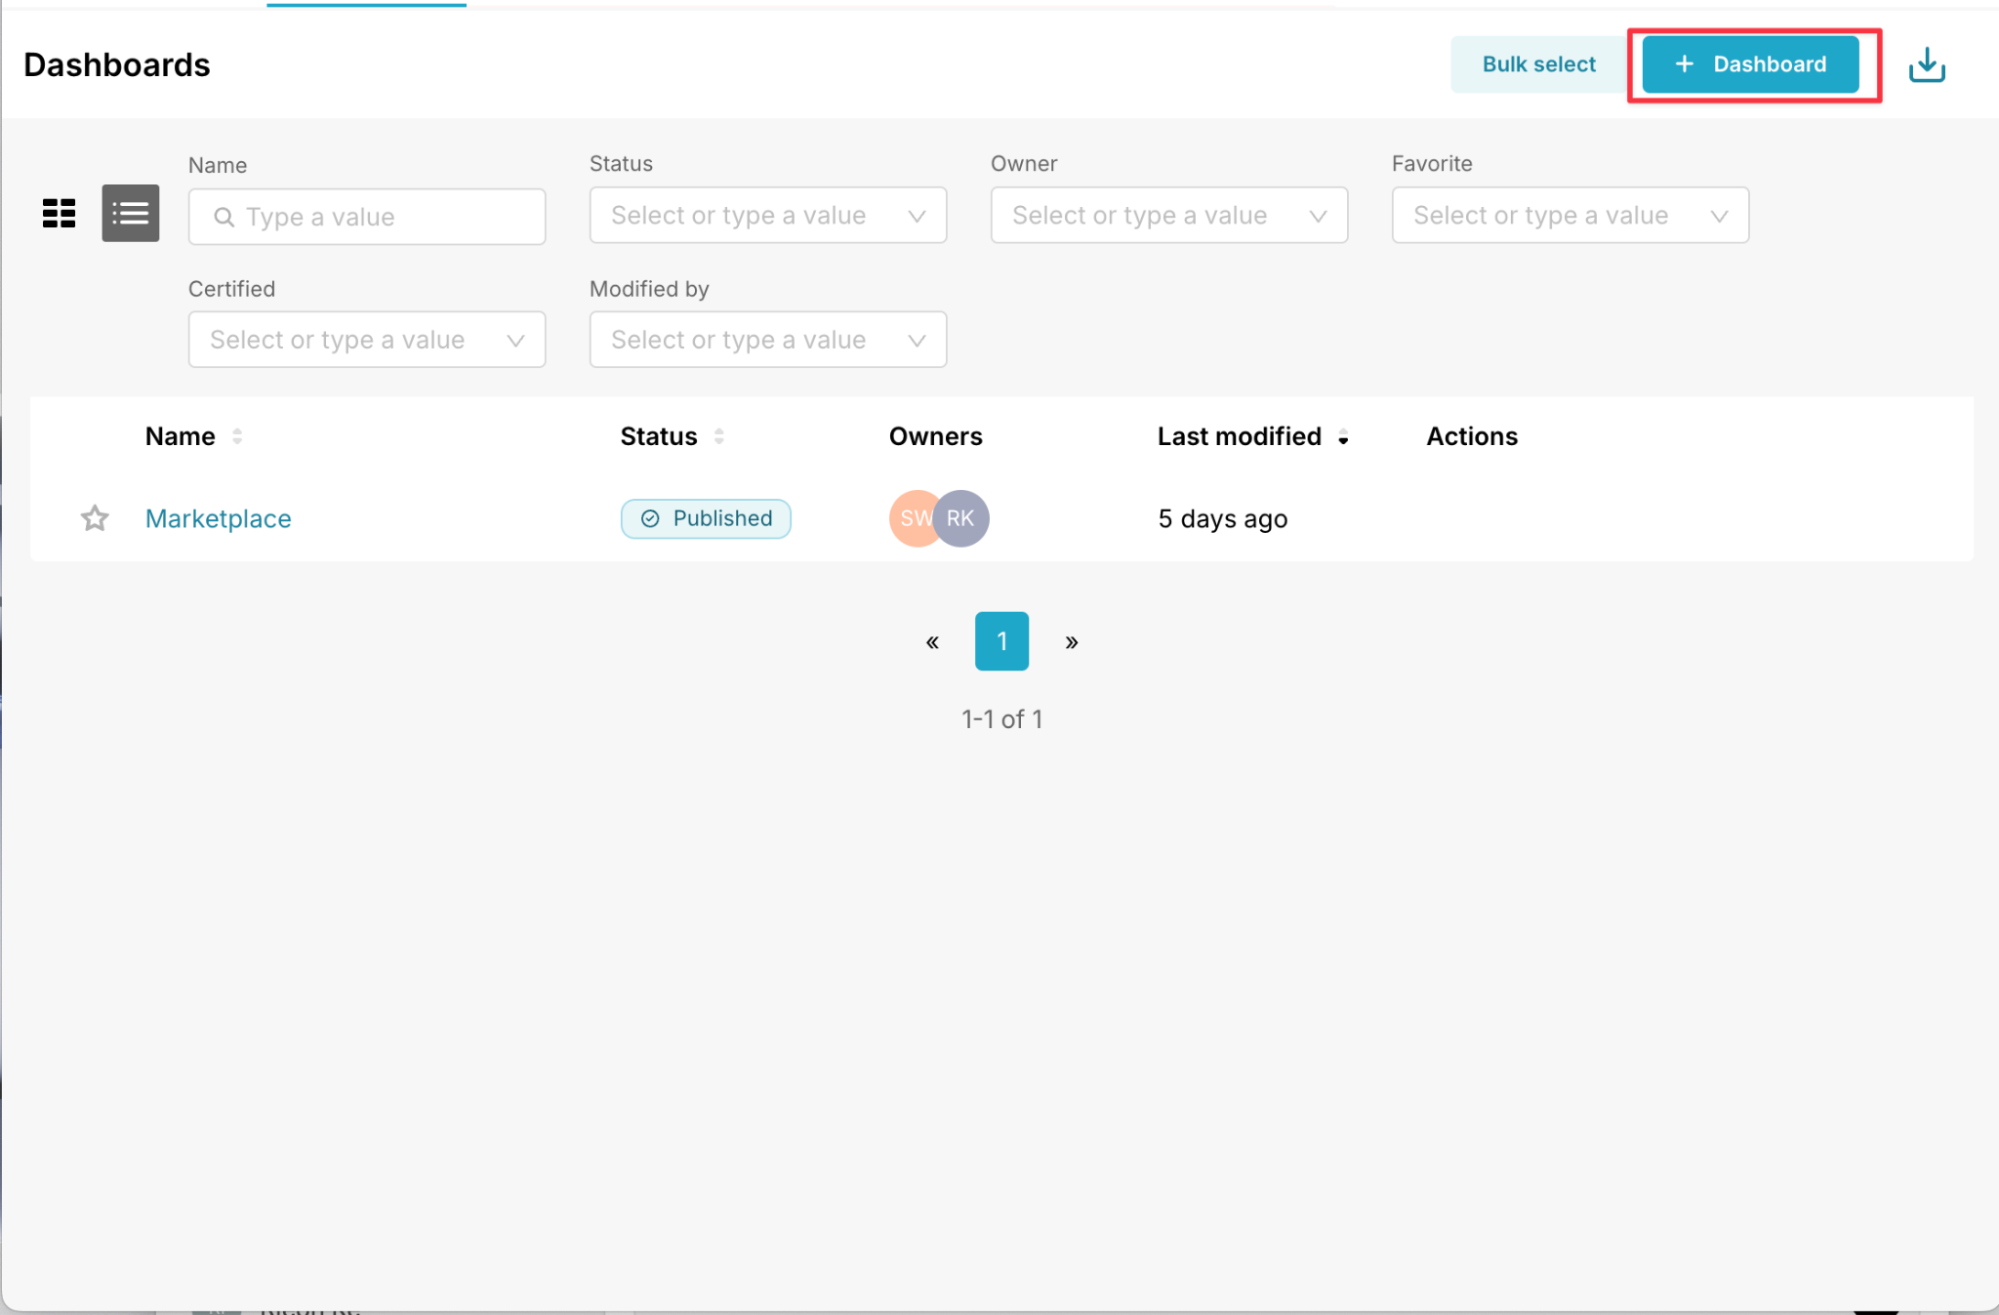
Create a New Dashboard
- Navigate to “Dashboards” by clicking the “Dashboards” tab in the navigation menu.
- Click the “New Dashboard” button on the top right corner to enter the dashboard design page.
-
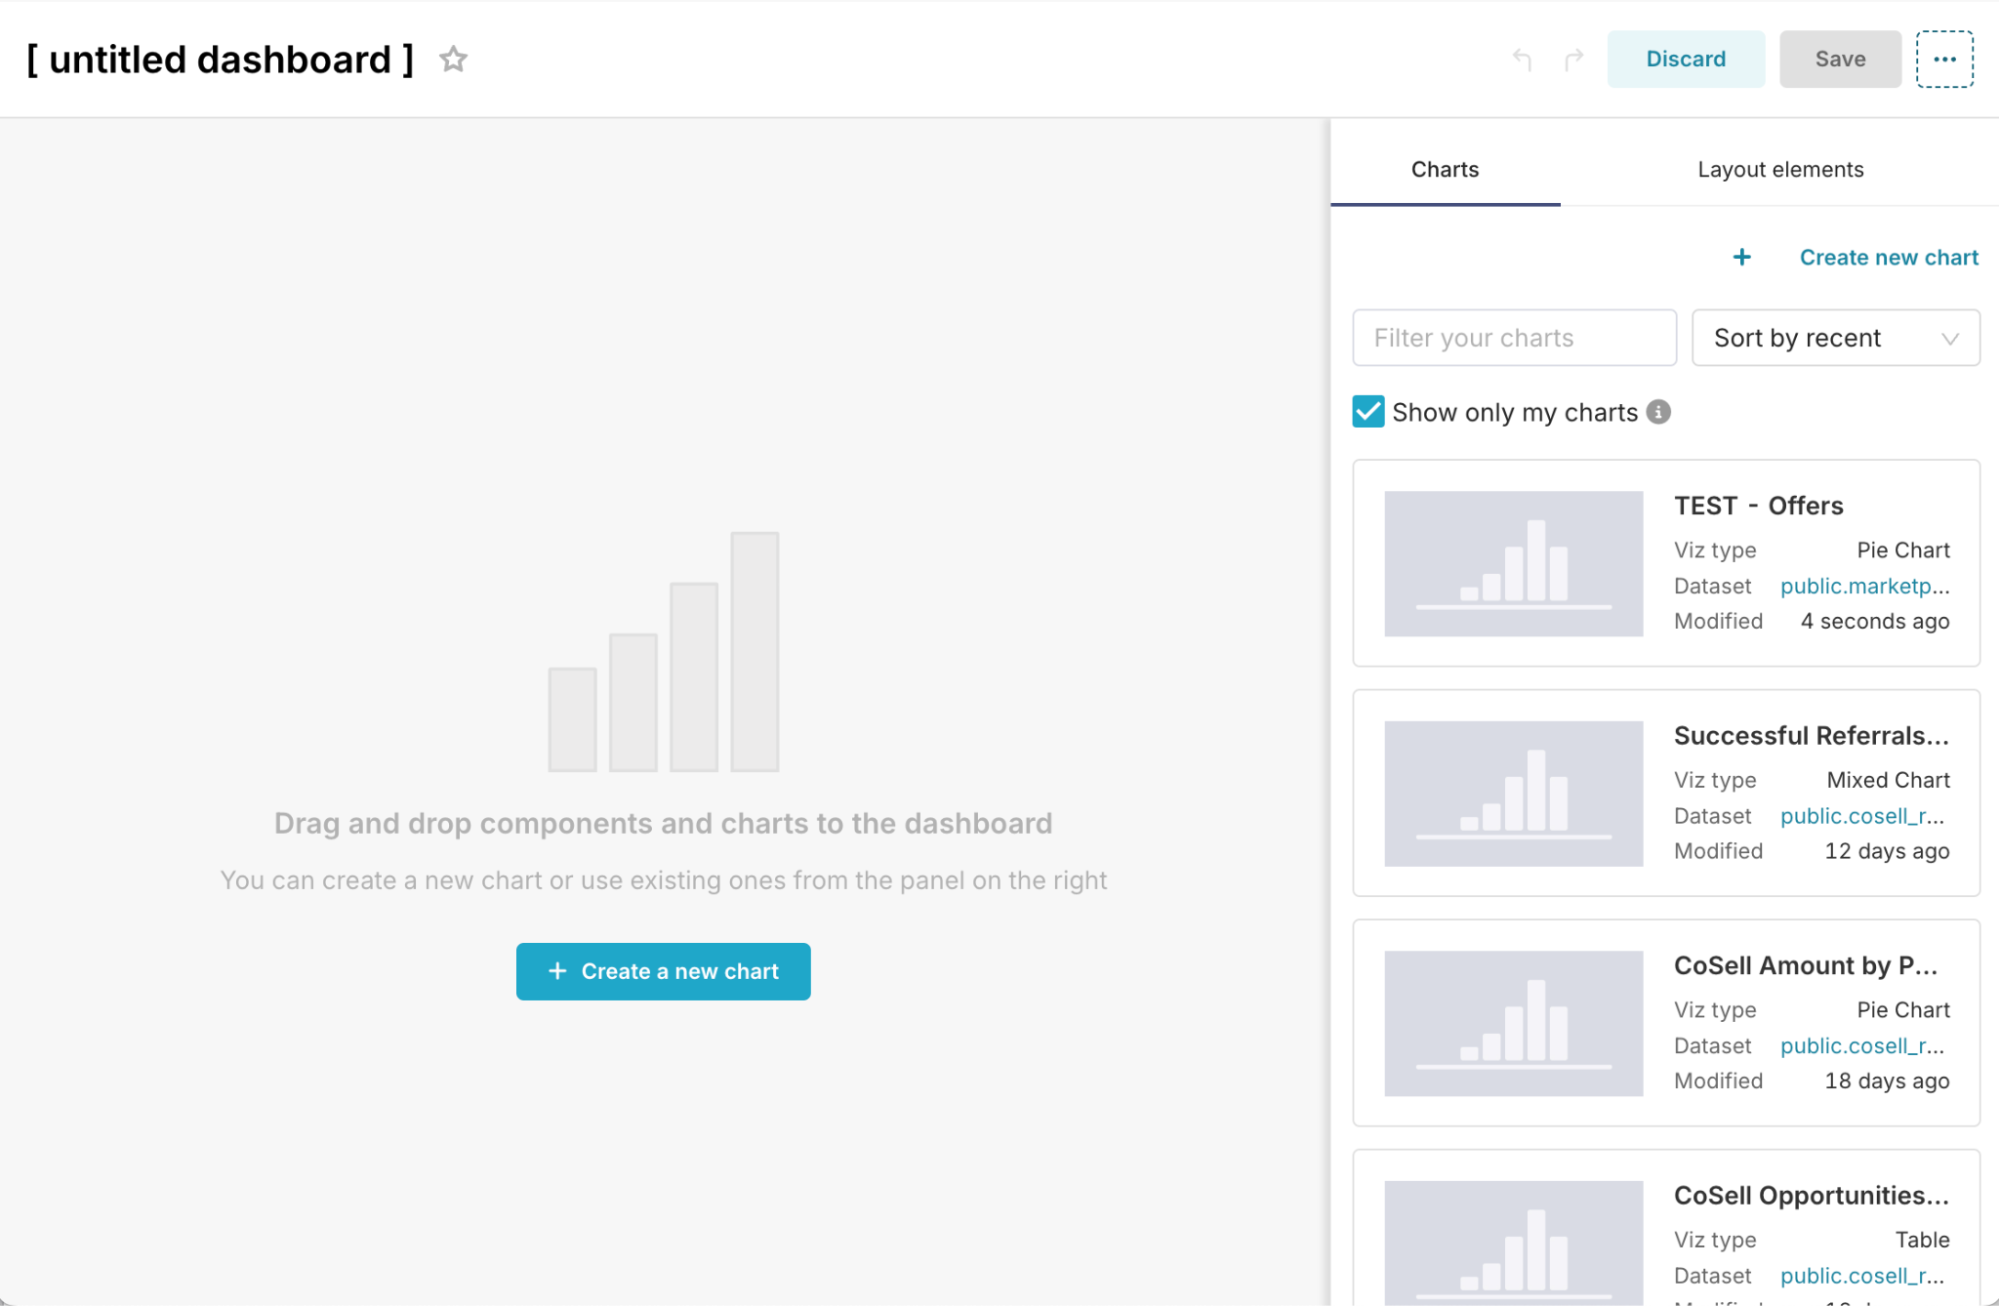
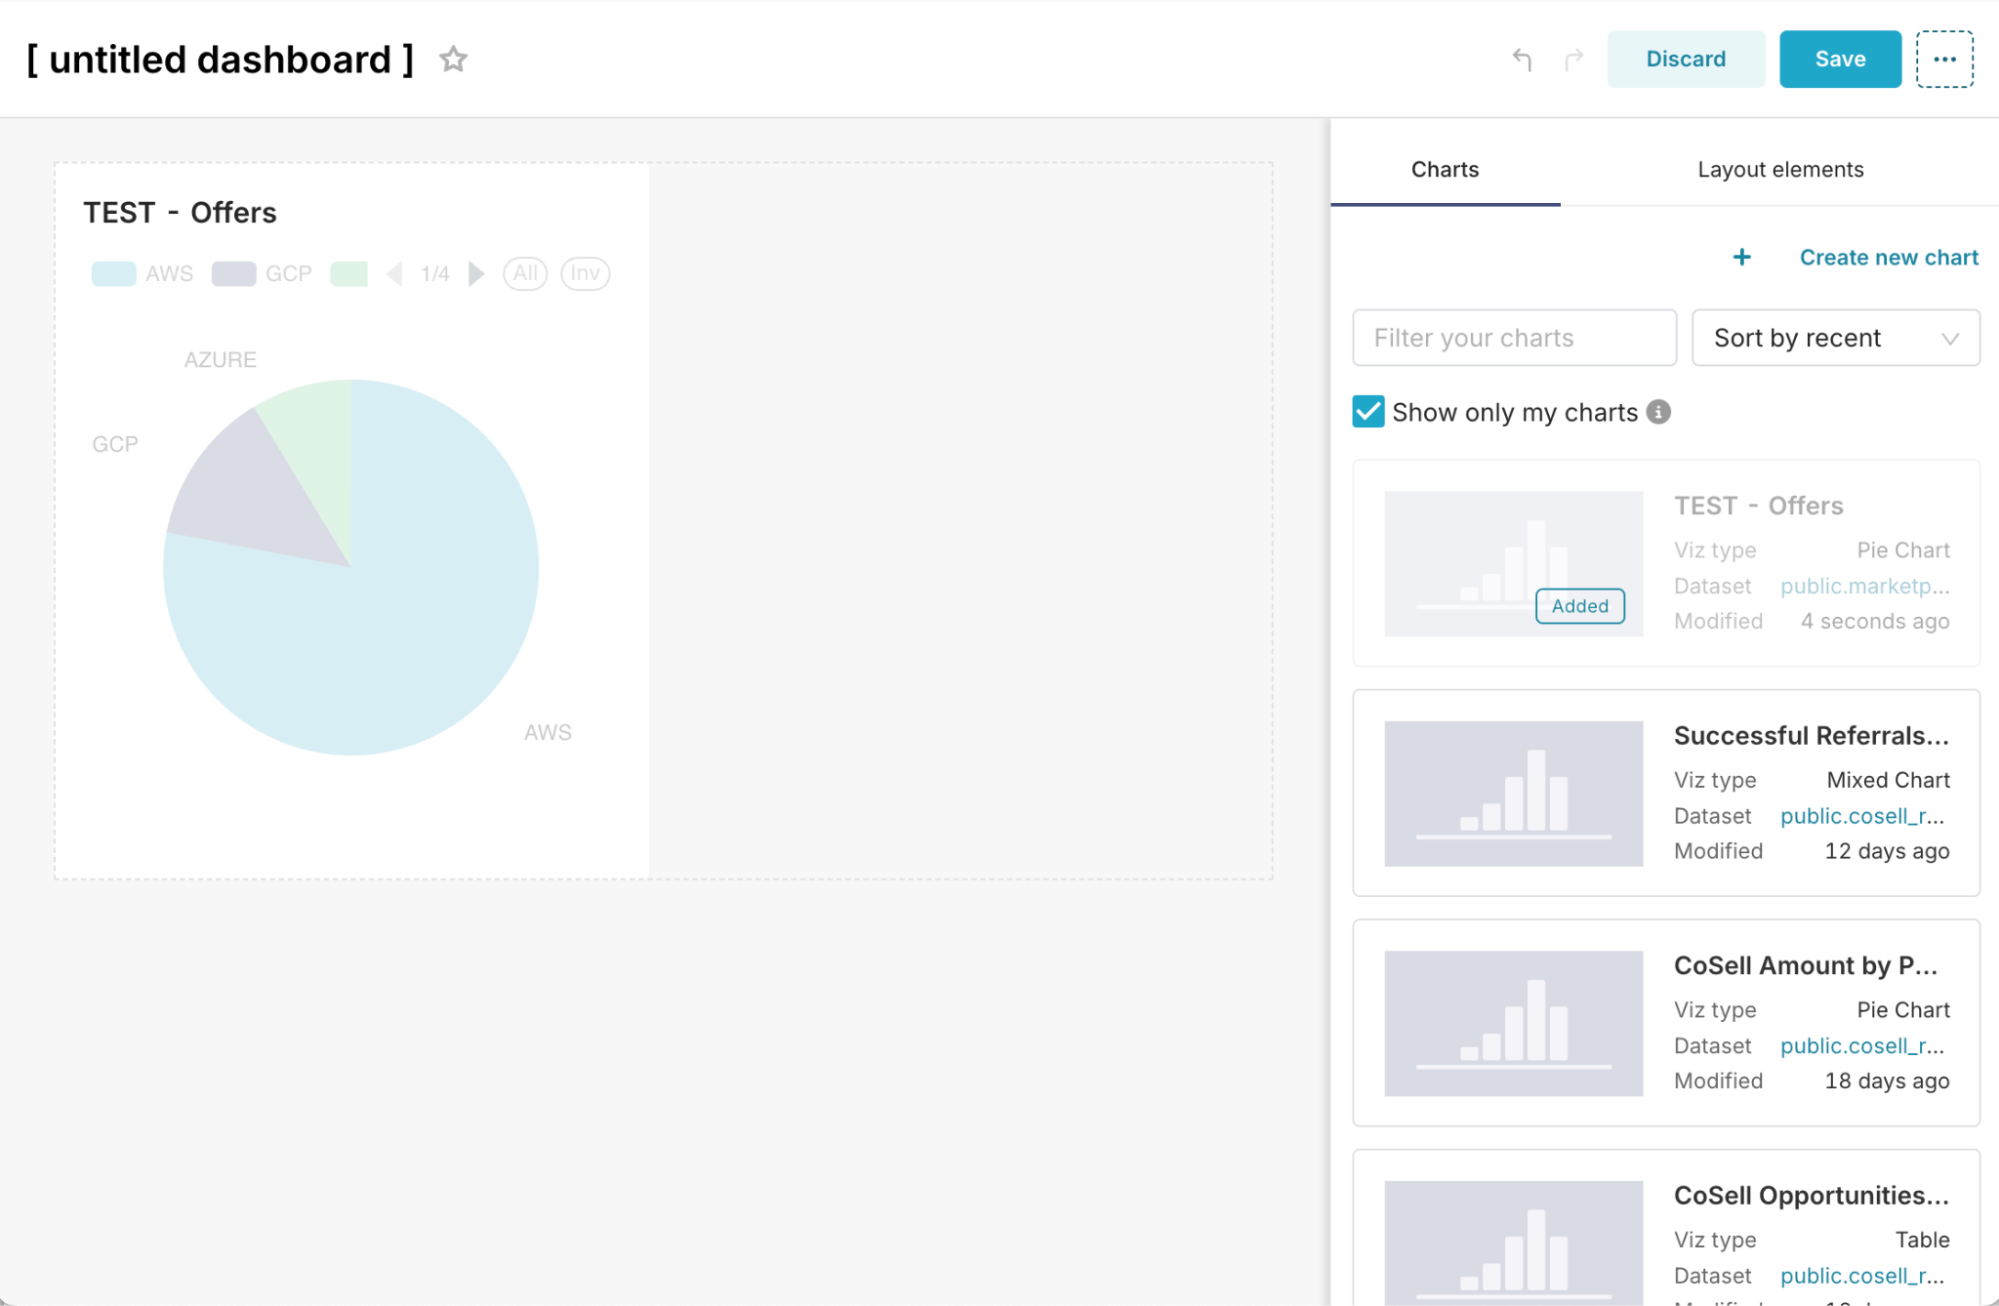
Design the Dashboard
- Drag and Drop Charts: On the left drawer, you’ll find all the available charts you’ve created. Drag and drop them onto the dashboard canvas to position them as needed.
- Organize Layout: Use layout elements (grids, containers, spacers) to keep everything aligned and visually appealing.
- Add Descriptions or Notes: Drag the “Text/Markdown” element to add explanatory text, descriptions, or markdown-formatted notes.
- Resizing and Moving Elements: Resize and move elements as needed to fine-tune the layout.
-
Edit the Dashboard Title
- Click on the title at the top of the dashboard design page to edit it.
- Enter a descriptive and relevant title (e.g., “Monthly Sales Overview” or “Customer Acquisition Trends”).
-
Save the Dashboard
After finalizing the design, click the “Save” button at the top-right corner of the dashboard design page.
Add Filters to Your Dashboard
Enhance the interactivity of your dashboard by adding and customizing filters. Filters allow users to dynamically change the data displayed, making it easier to explore specific aspects of the data without altering the dashboard’s structure.
Tips for Effective Filters
- Dynamic Filters: Enable users to interact with charts directly (e.g., by clicking a chart element to filter data in real-time).
- Clear Naming: Ensure filters are clearly labeled to indicate their purpose (e.g., “Select Date Range” or “Choose Partner”).
- Limit Filter Options: Avoid overwhelming users with too many filter options. Keep them relevant to the dashboard’s purpose.
Steps to Add and Edit Filters
-
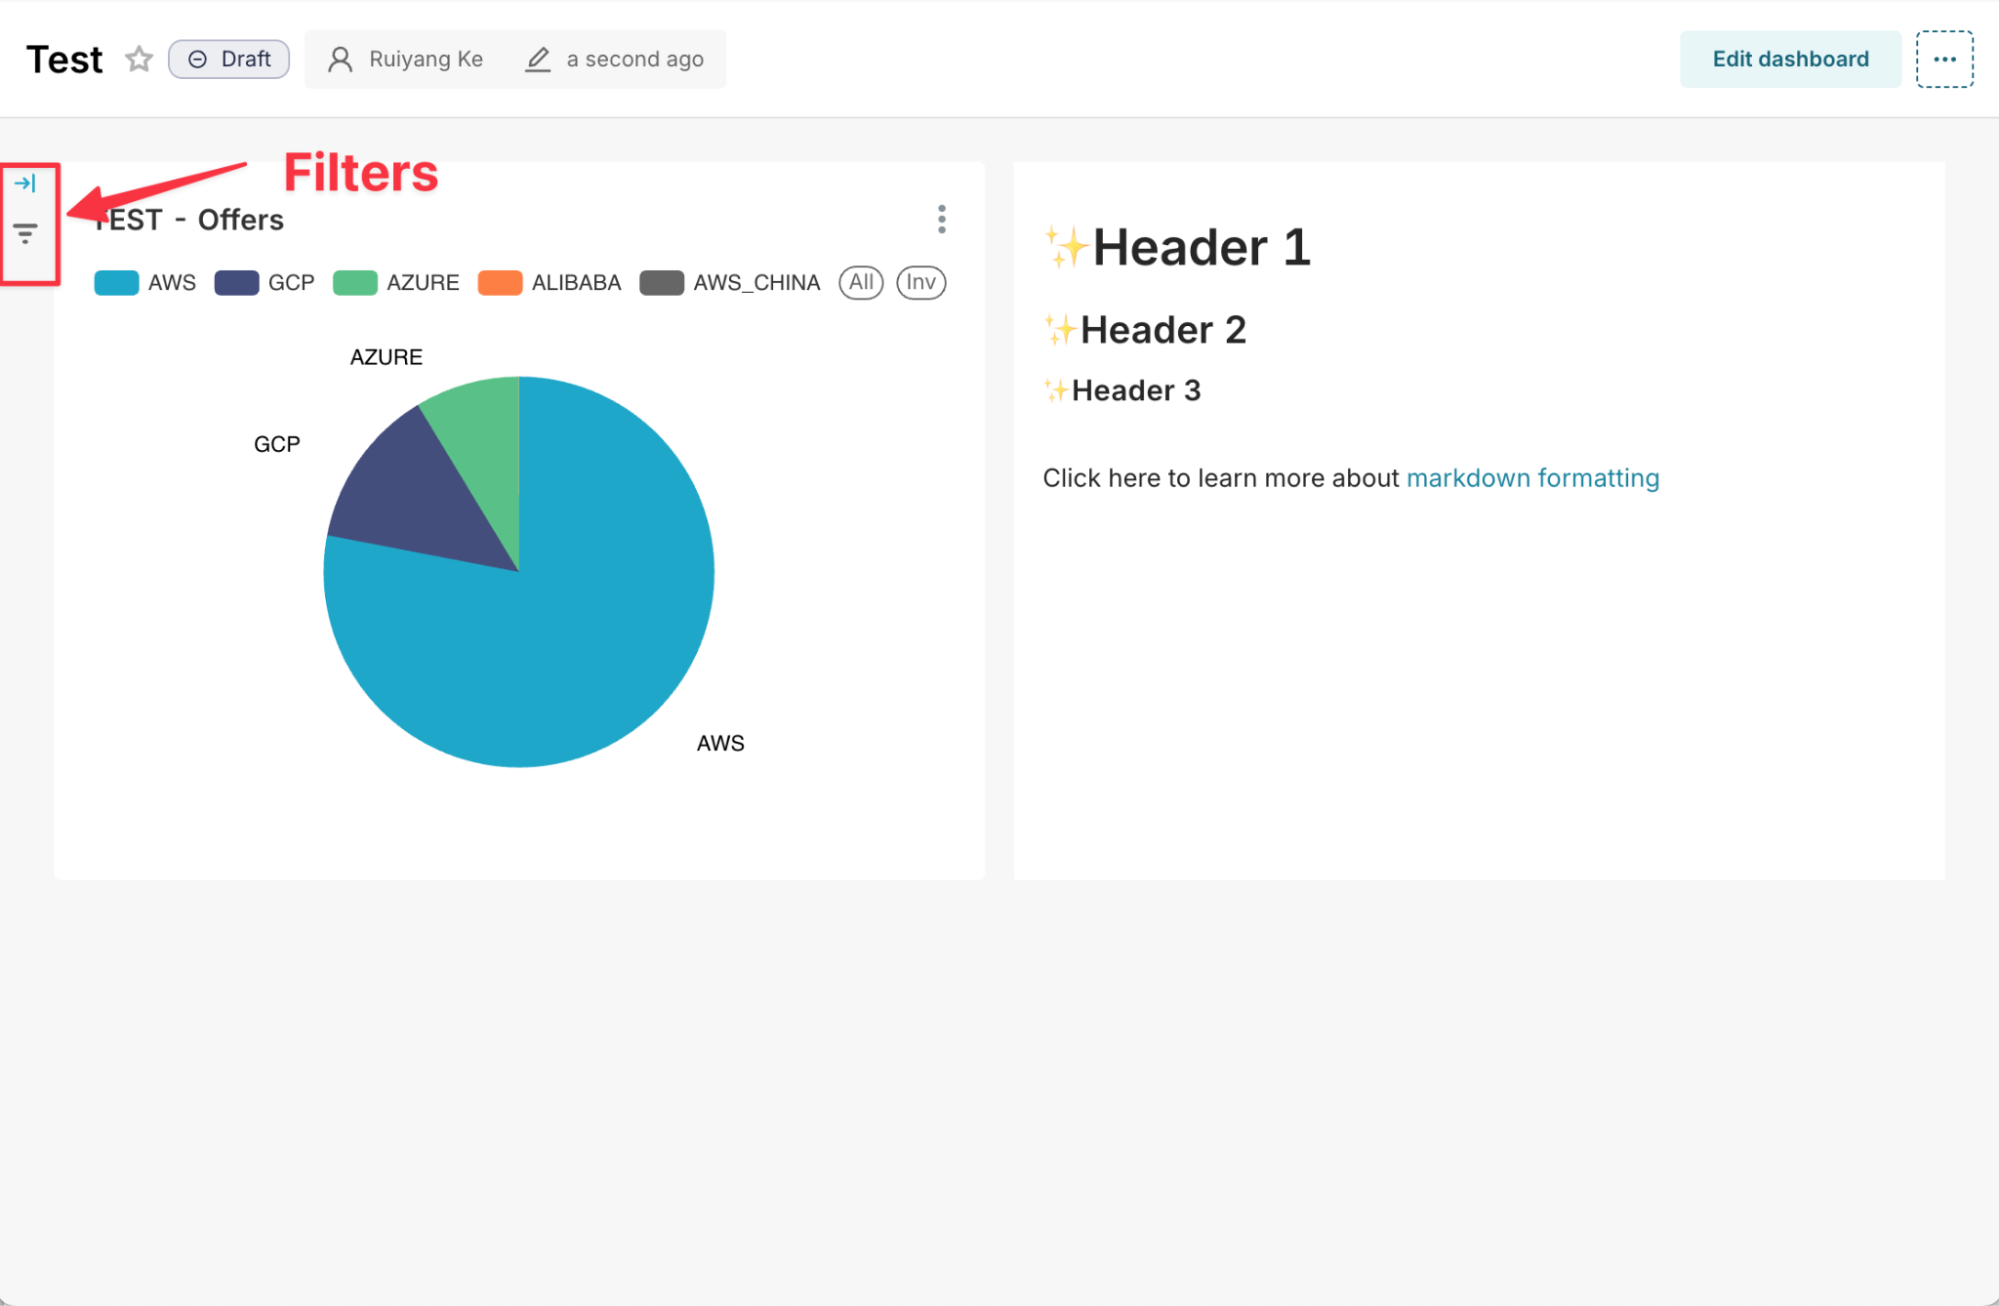
Open the Filter Panel
- After saving your dashboard, the filter panel will appear on the right side. Adjust its layout according to your preference.
-
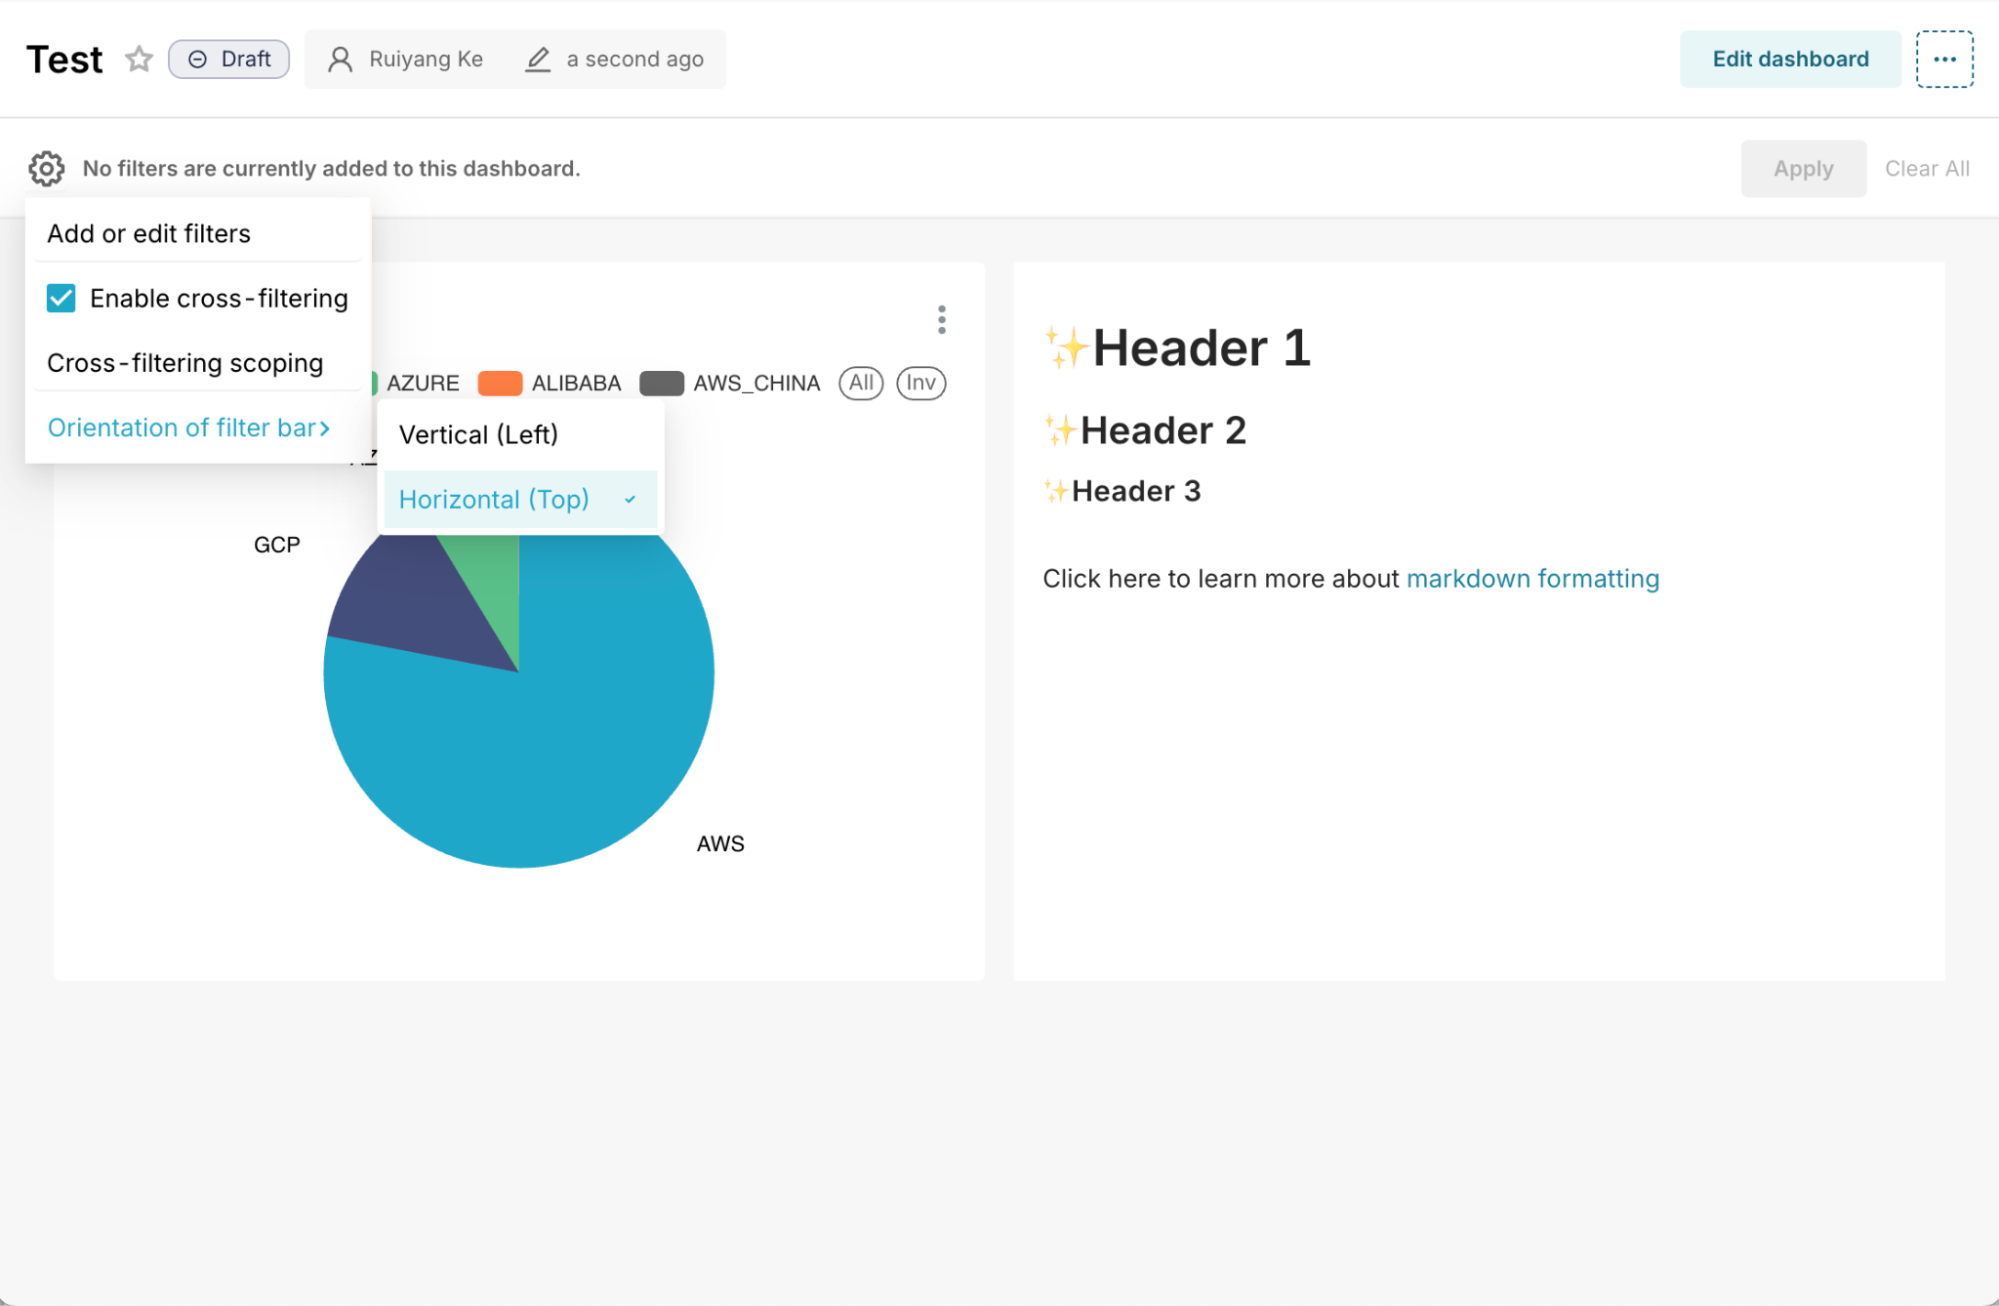
Change Filter Panel Orientation
- Click the gear icon on the filter panel to open filter settings.
- From the dropdown menu, choose the “Orientation of Filter Bar” option.
- You can select “Horizontal (Top)” to position the filter bar at the top or “Vertical (Left)” to place it on the left side.
-
Add or Edit Filters
- Click the gear icon again and select “Add and Edit Filters” to open the filter configuration modal.
- Add a New Filter: Click “Add Filter” to create a new filter (e.g., date filters, category filters).
- Edit Existing Filters: Modify any existing filters by clicking on them and updating their settings.
-
Configure Filter Details
- Select the filter type (e.g., dropdowns, multi-select lists, date pickers).
- Define the scope of the filter, specifying which charts or widgets will be affected.
- Set default filter values to load with pre-defined selections.
-
Save the Filters
After configuring the filters, click “Save” to apply them to the dashboard.
As Of Date Filter
The “As Of Date” filter ensures your data is accurately represented at a specific point in time. Without this filter, data might be duplicated or appear multiple times due to missing time-based context.
Why Add an As Of Date Filter?
- Data Snapshots: Suger captures data at specific times. Without the filter, the dashboard may show inflated or inconsistent data.
- Prevent Data Explosion: Without it, the same data may appear multiple times across different dates.
- Time-Based Comparisons: The filter ensures accurate comparisons across dates.
How to Add the As Of Date Filter
-
Open the Filter Configuration
- Navigate to the filter panel and click the gear icon.
- Select “Add and Edit Filters” from the dropdown to access the filter configuration modal.
-
Add a New Filter
- Click “Add Filter” and choose “As Of Date” from the list.
-
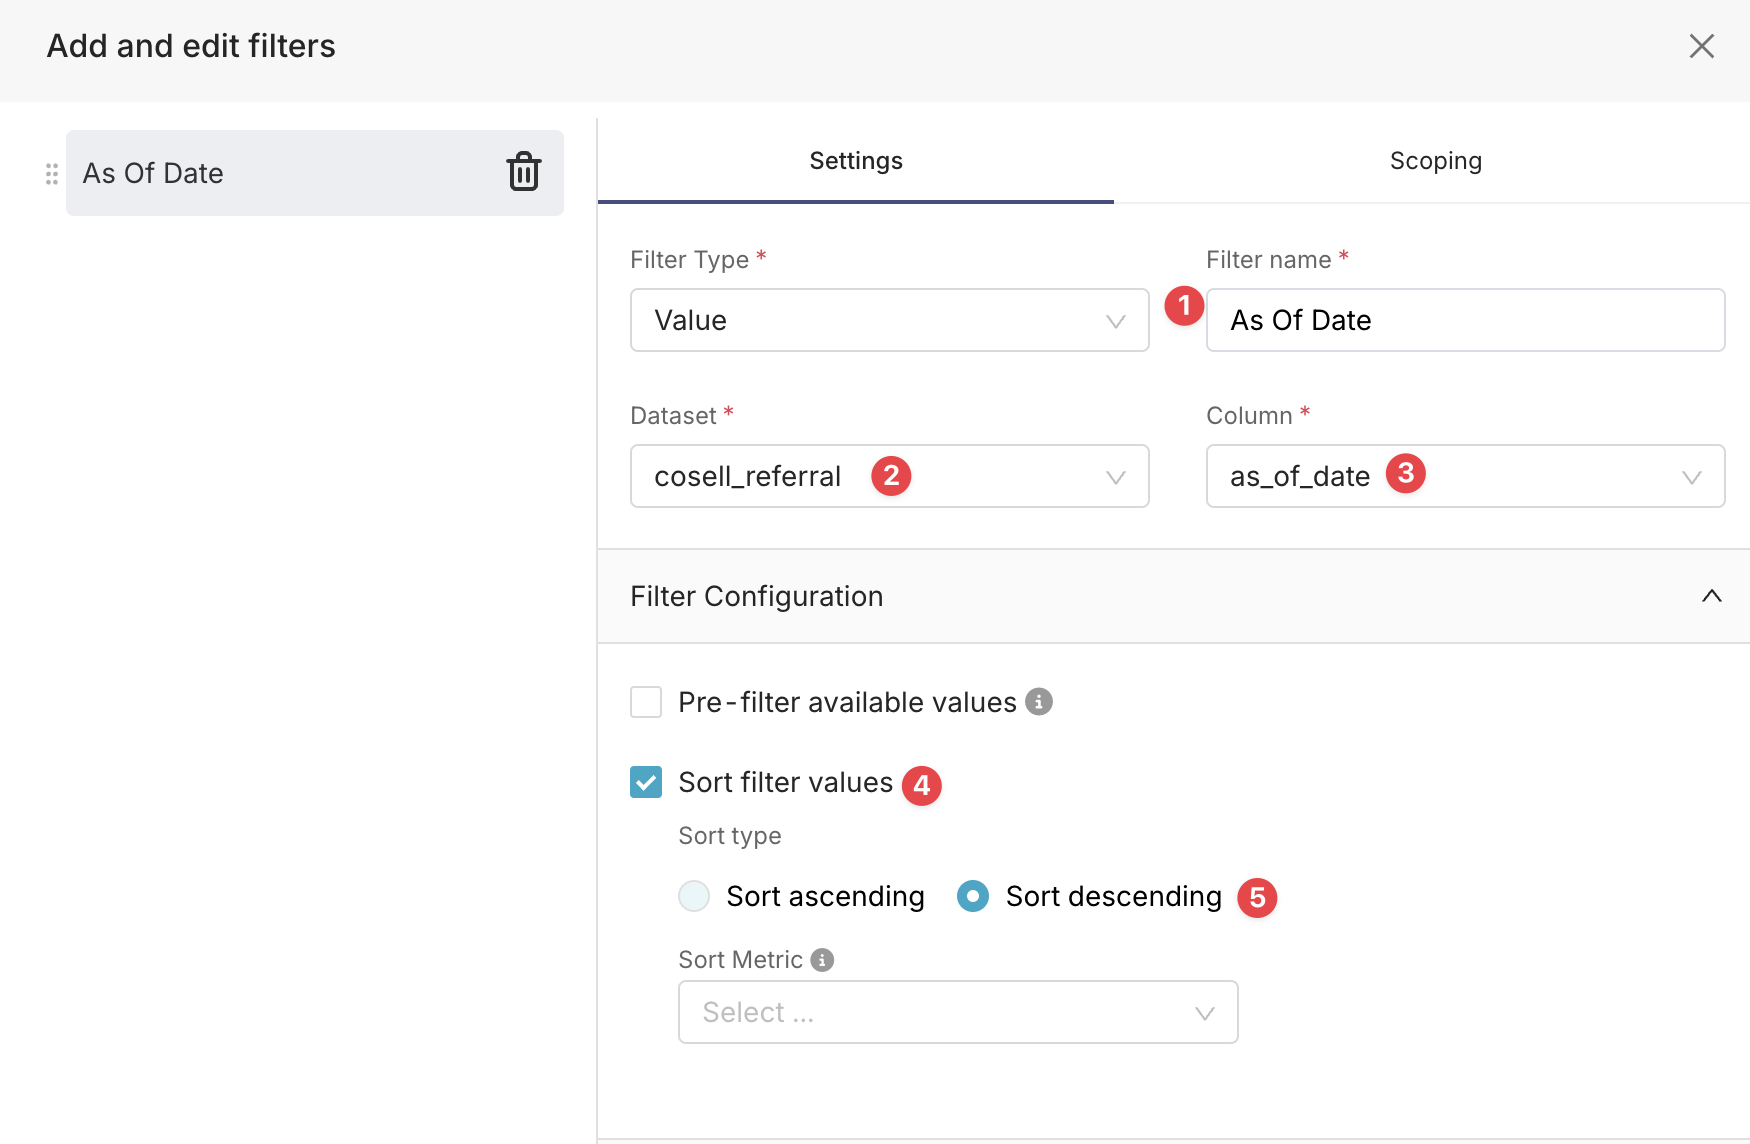
Configure the As Of Date Filter
- Sort Filter Values: Set the filter values to display in descending order, ensuring the most recent dates appear first.
- Set Filter as Required: Mark the “Filter Value is Required” option to ensure users select a valid date.
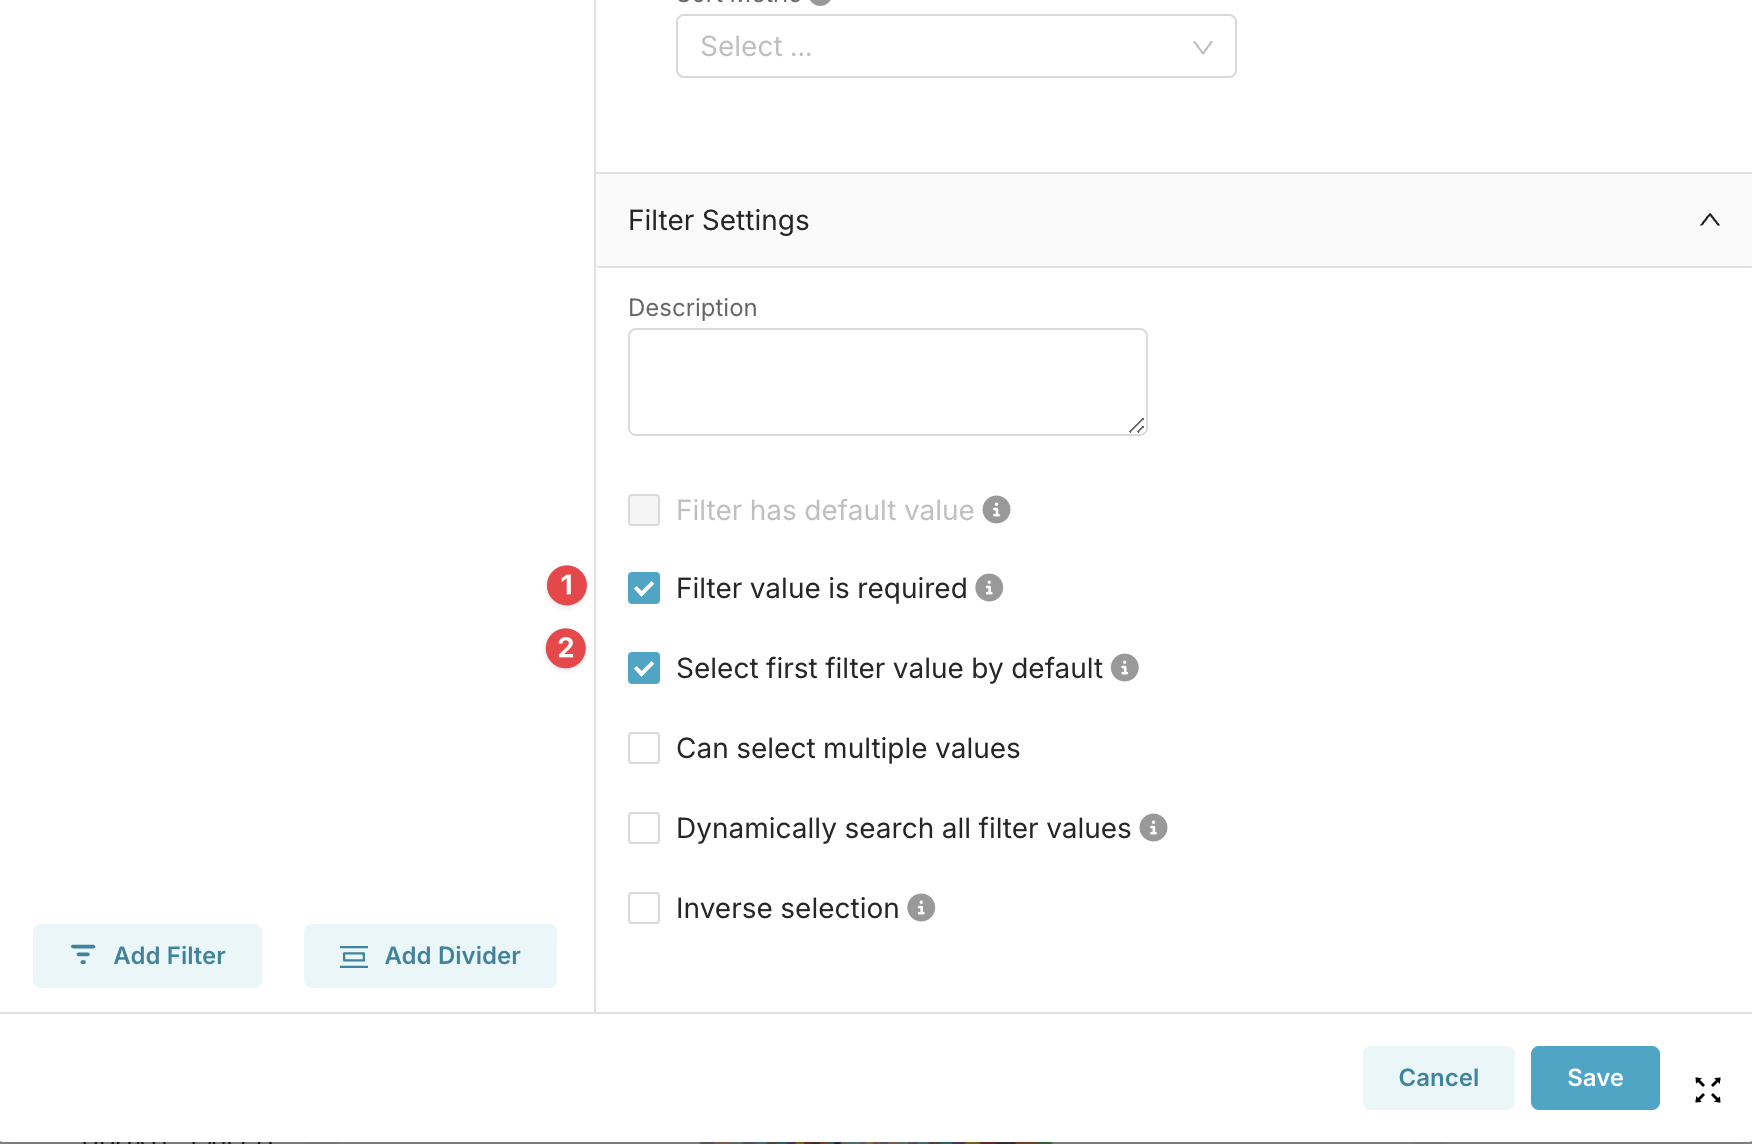
-
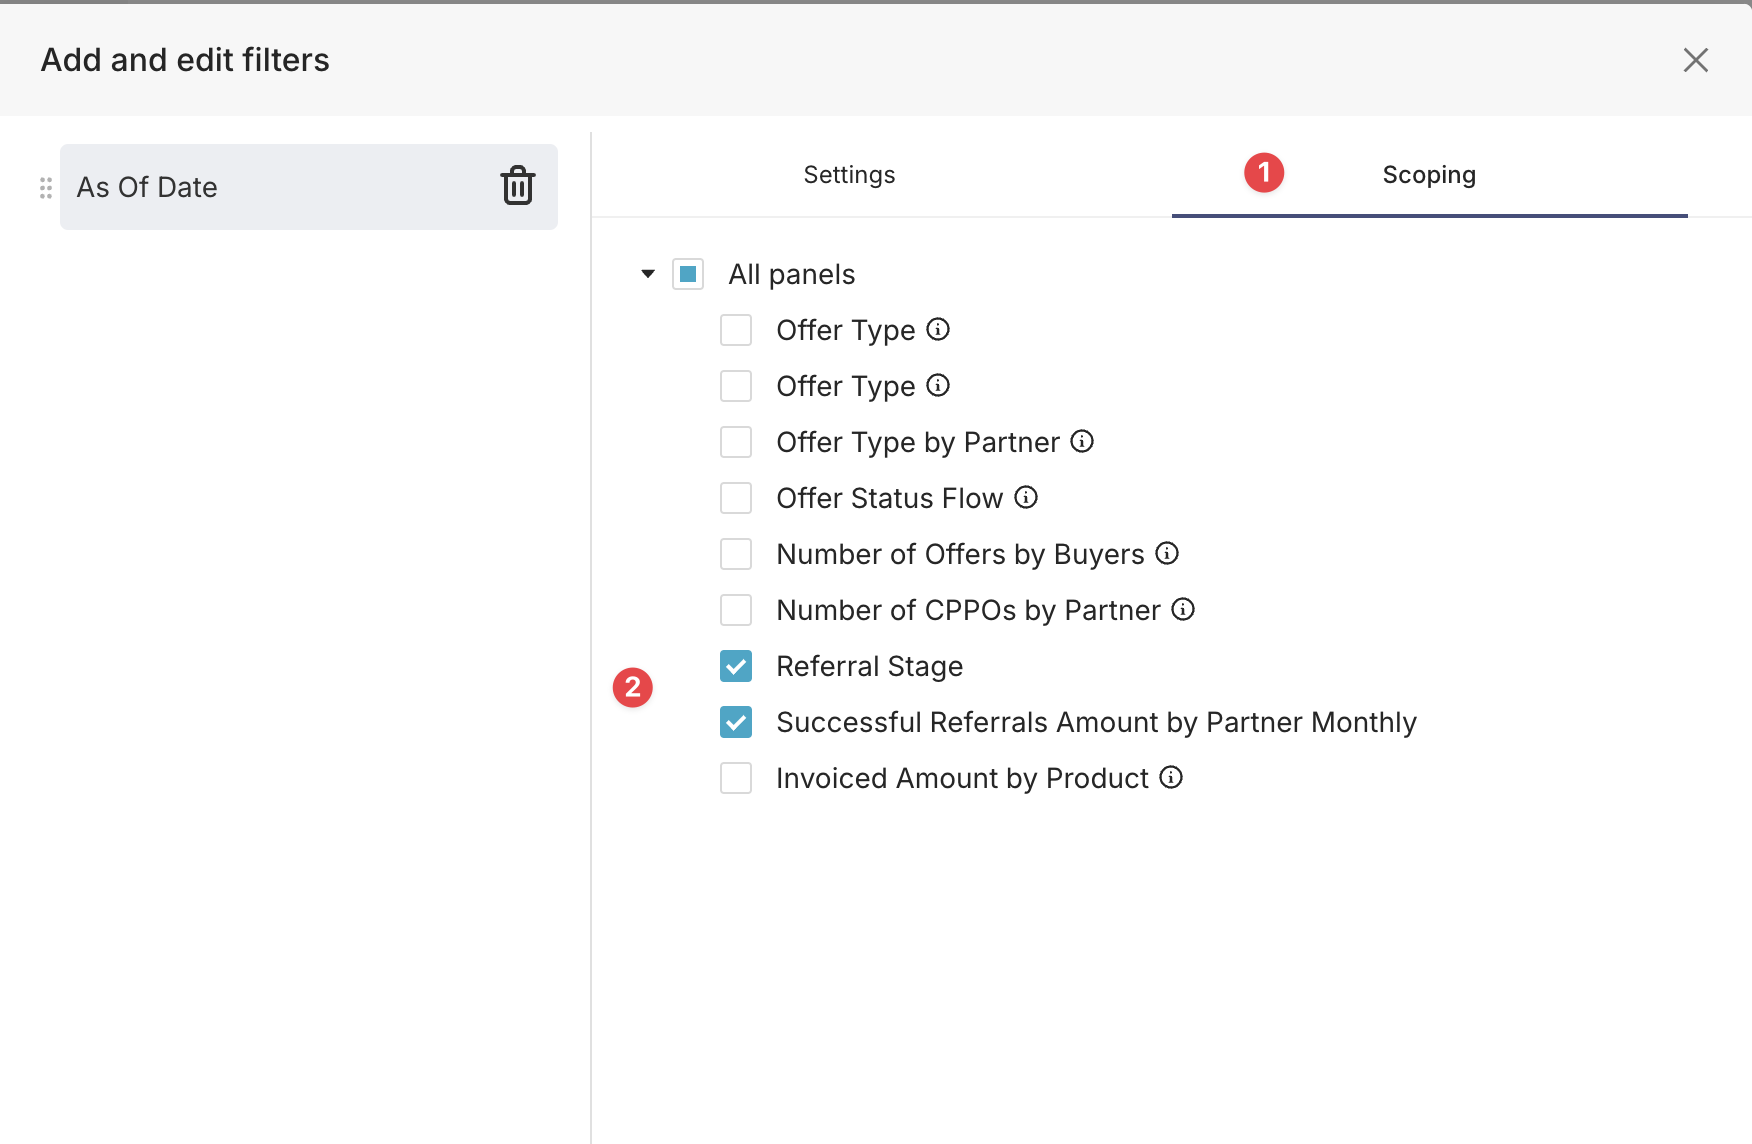
Set Default Value and Scope
- Set a default date for the filter (e.g., today’s date or a pre-set range).
- Specify which charts or widgets will be affected by the As Of Date filter.
-
Save the Filter
After configuring the filter, click “Save” to apply it to your dashboard.
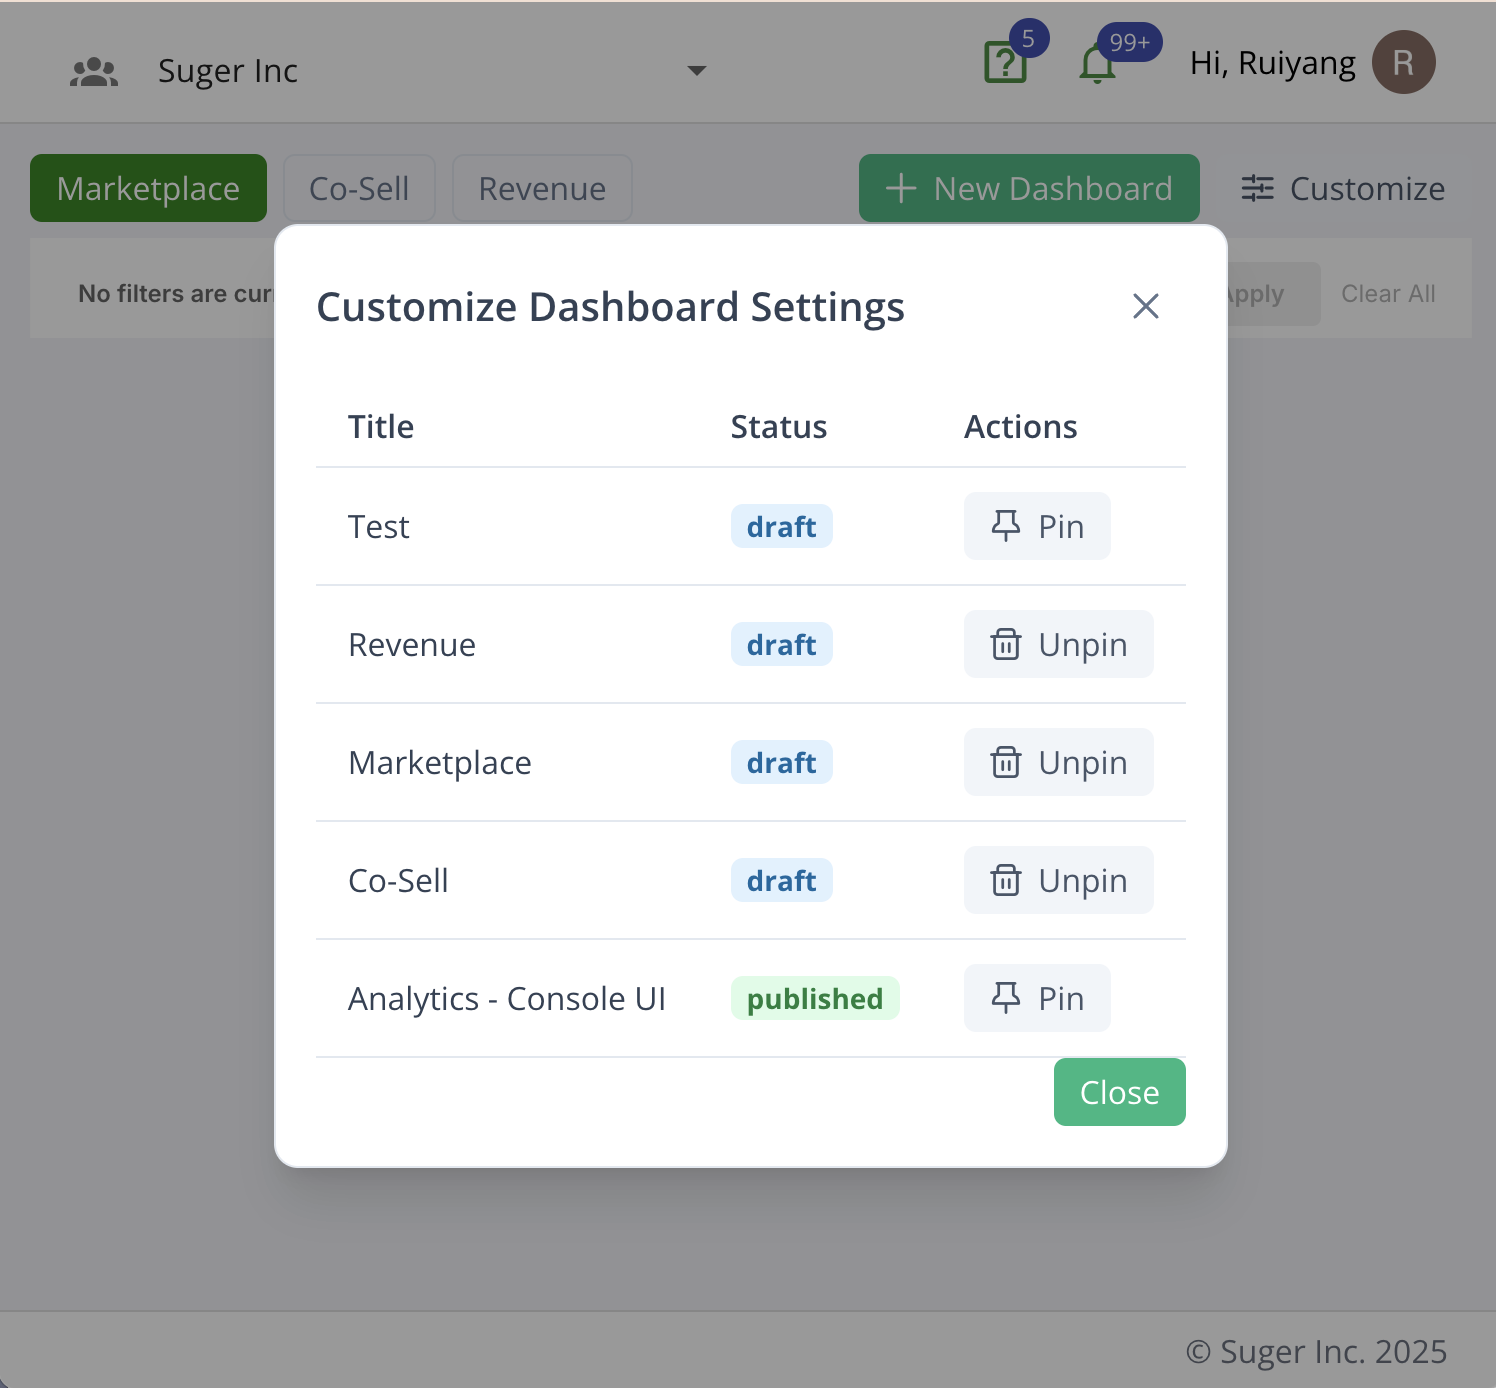
Pin a Dashboard in Suger Console
Pinning a dashboard helps keep your most important or frequently used dashboards easily accessible in the Suger Console.
-
Navigate to Suger Analytics from Console
- Log in to the Suger Console at Suger Console.
- Click the “Analytics” menu item on the left.
- Click the “Customize” button on the top right corner.
-
Pin Dashboards
- Click the “Pin” button to pin a dashboard in Suger Console.
- Click “Unpin” to remove it from the pinned list.