Billing Dashboard Guide
How to navigate the billing tab in your Suger console to monitor AI usage, view invoices, and understand your costs.
Accessing the Billing Dashboard
Navigate to Settings > Billing in the Suger console. The billing tab is available for all organization members.
Status Banners
If there is an issue with your AI billing, a banner appears at the top of the page:
| Banner Color | Meaning | What to Do |
|---|---|---|
| Yellow (Warning) | AI features paused — spending cap reached | Wait for the next billing cycle, or contact Suger support to request a cap increase |
| Red (Error) | AI features disabled — payment issue | Update your payment method or contact support |
| Red (Error) | AI features disabled — manually disabled | Contact Suger support |
If no banner appears, your AI features are active and working normally.


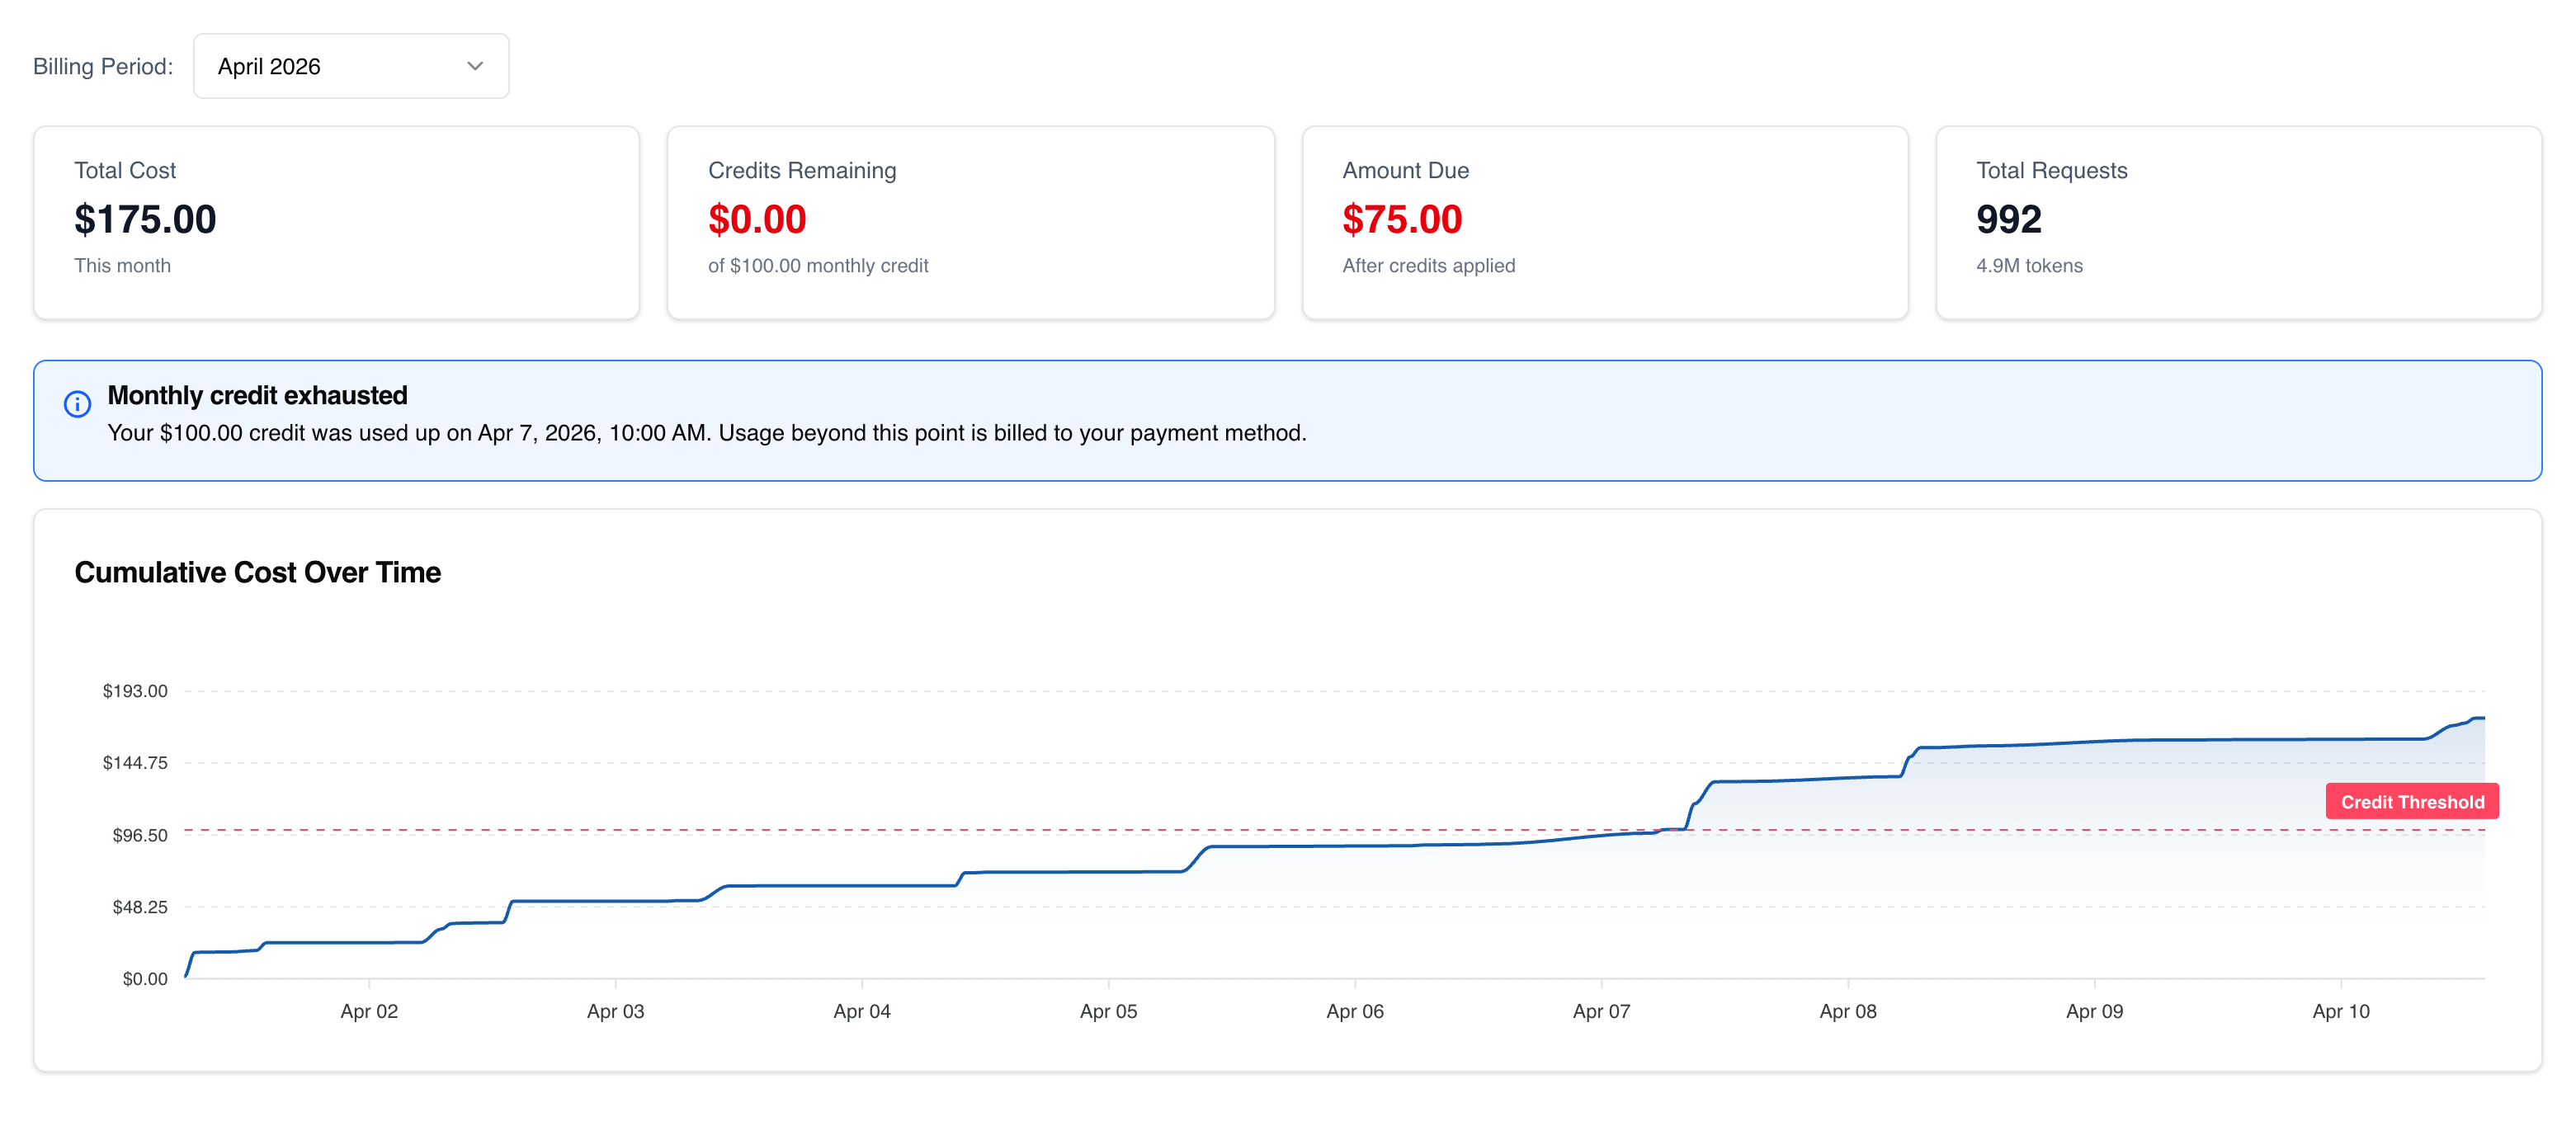
Summary Cards
Four cards at the top show your key billing metrics for the selected month:
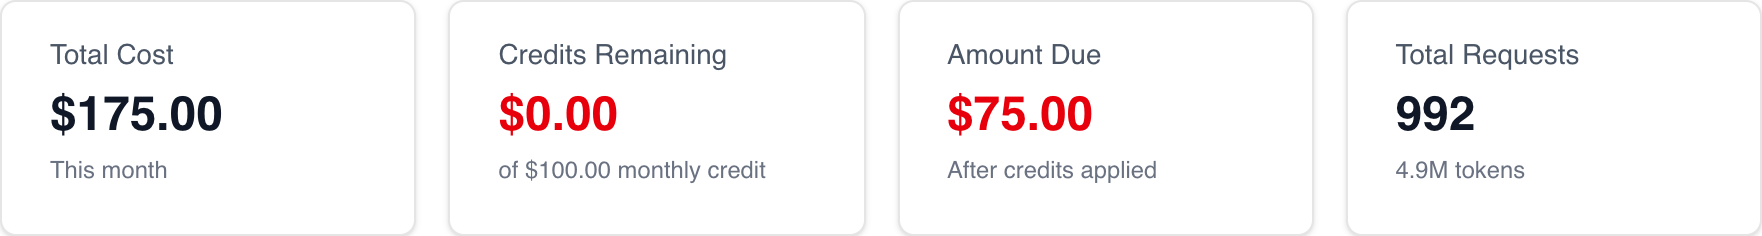
Total Cost
Your total AI usage cost for the period. This is the raw cost before credits are applied.
Credits Remaining
How much of your monthly credit is left (default is $100/month, but your organization’s amount may differ). Color-coded:
- Green: More than $25 remaining
- Orange: Less than $25 remaining (but not fully used)
- Red: Credit fully used
Amount Due
The amount you owe after credits are applied. If your usage is under $100, this will be $0.
Total Requests
The total number of AI requests made, with a total token count shown below.
Credit Exhaustion Alert
If your $100 monthly credit has been fully used, a blue info banner appears showing the date the credit was exhausted. Any usage beyond this point is billed to your payment method.

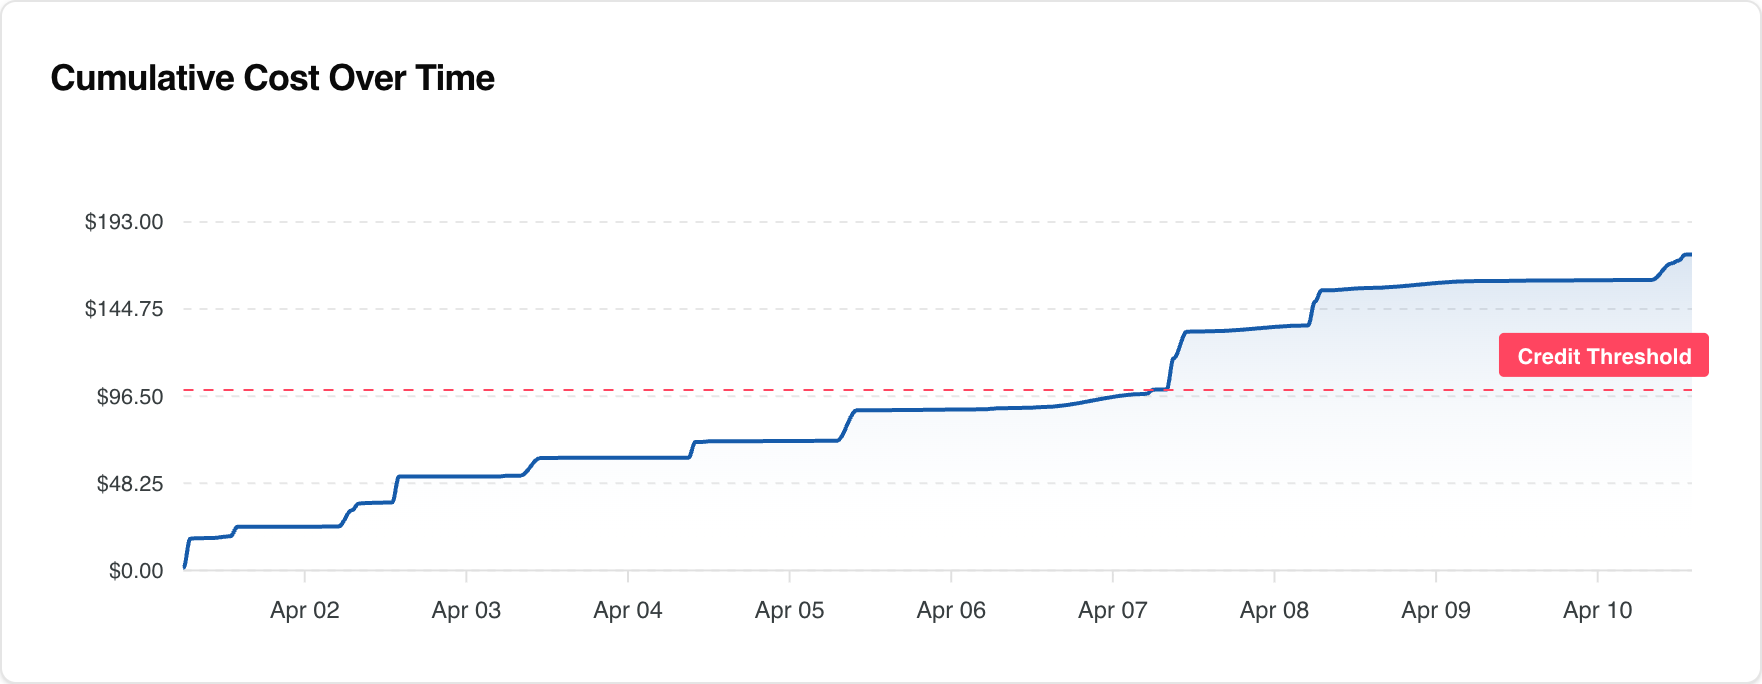
Usage Over Time Chart
An area chart showing your cumulative AI costs over the billing period.
- The red dashed line marks the monthly credit threshold (currently set at the default $100 for all organizations — note: this line does not adjust for custom credit amounts)
- When the curve crosses this line, you’ve exceeded your free credit
- Hover over any point to see the exact date and cumulative cost
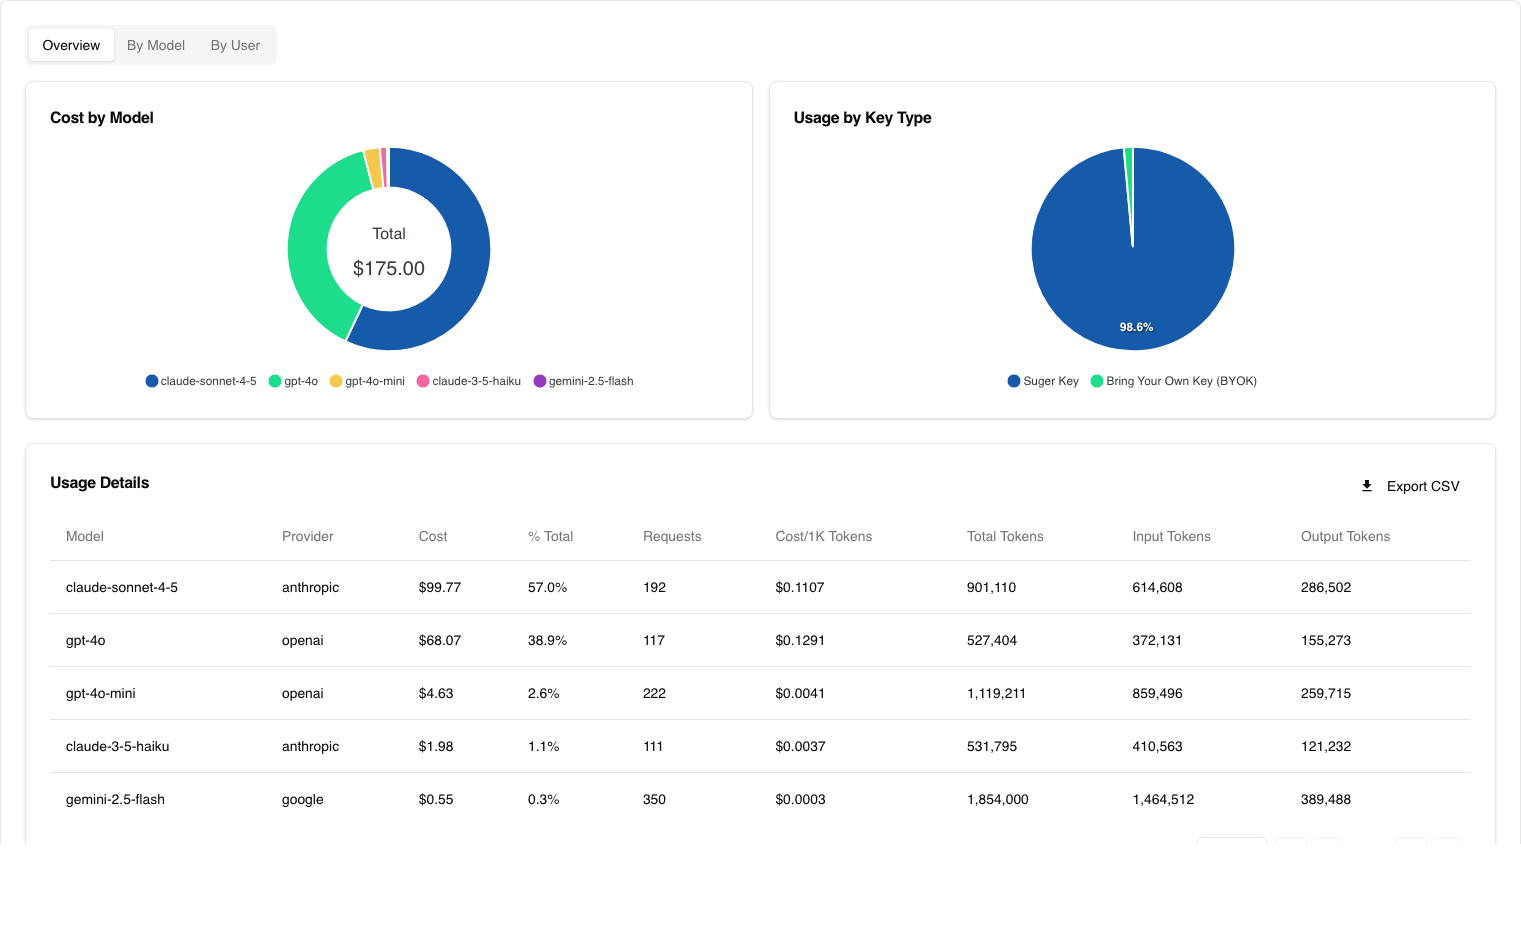
Usage Breakdown Tabs
Three tabs provide different views of your usage data:
Overview Tab
Available to all members.
- Cost by Model — donut chart showing how costs are distributed across AI models
- Key Type Distribution — pie chart showing Suger Key vs BYOK usage (only shown if you use both)
- Usage Details Table — detailed table with columns:
- Model, Provider, Cost, % of Total, Requests, Cost per 1K Tokens, Total Tokens, Input Tokens, Output Tokens
- Sortable and paginated
- CSV Export button to download the data
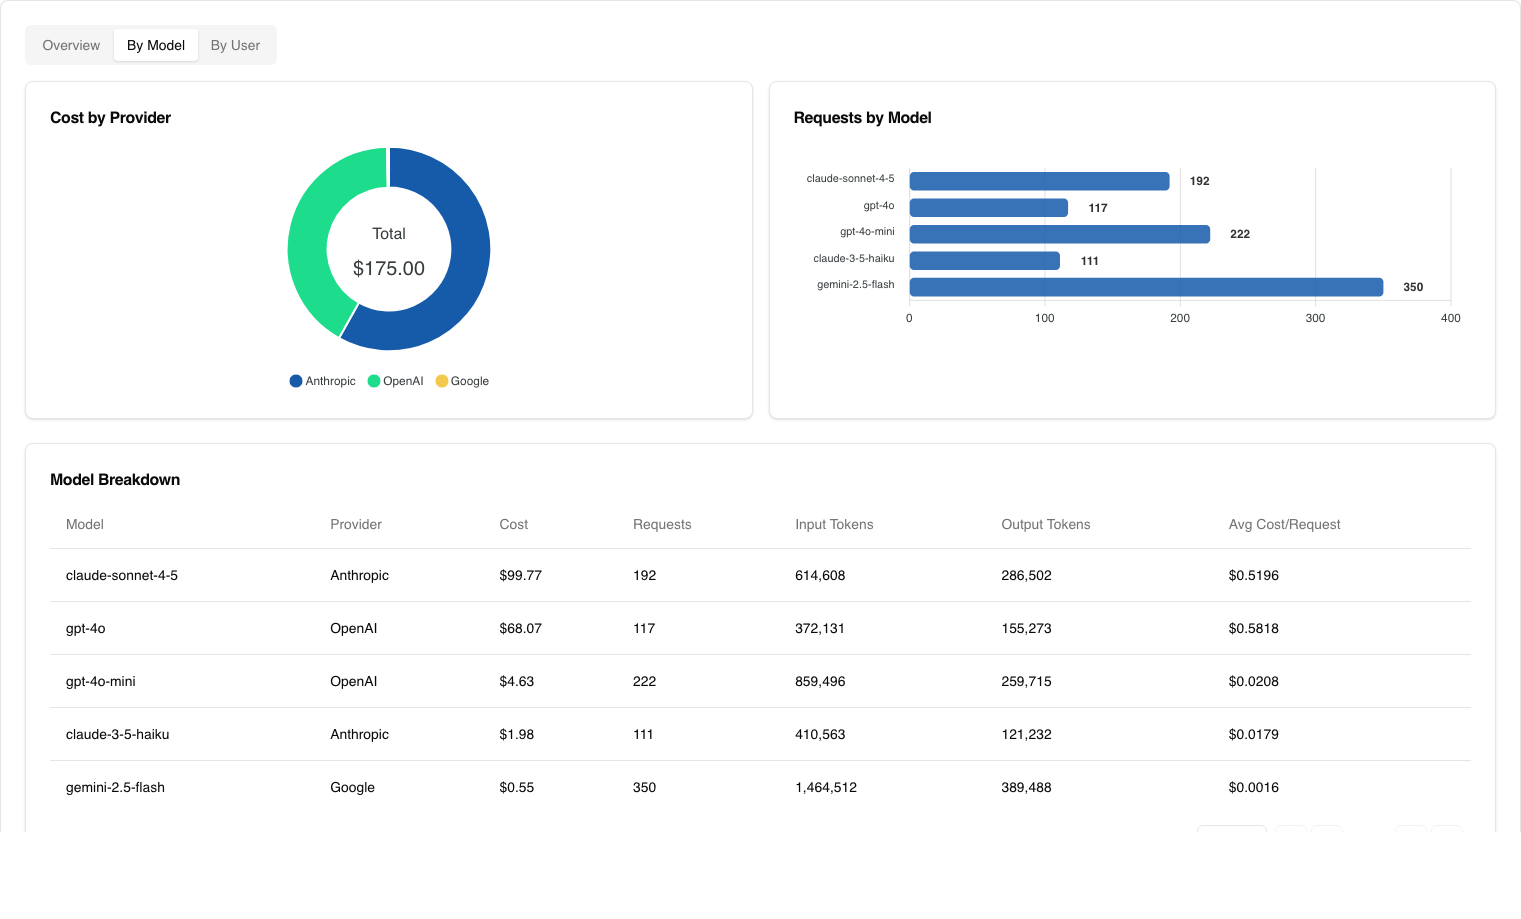
By Model Tab
Available to all members.
- Cost by Provider — donut chart showing spend across providers (OpenAI, Anthropic, Google)
- Requests by Model — horizontal bar chart showing request volume per model
- Model Breakdown Table — same detail columns as the Overview table, grouped by model
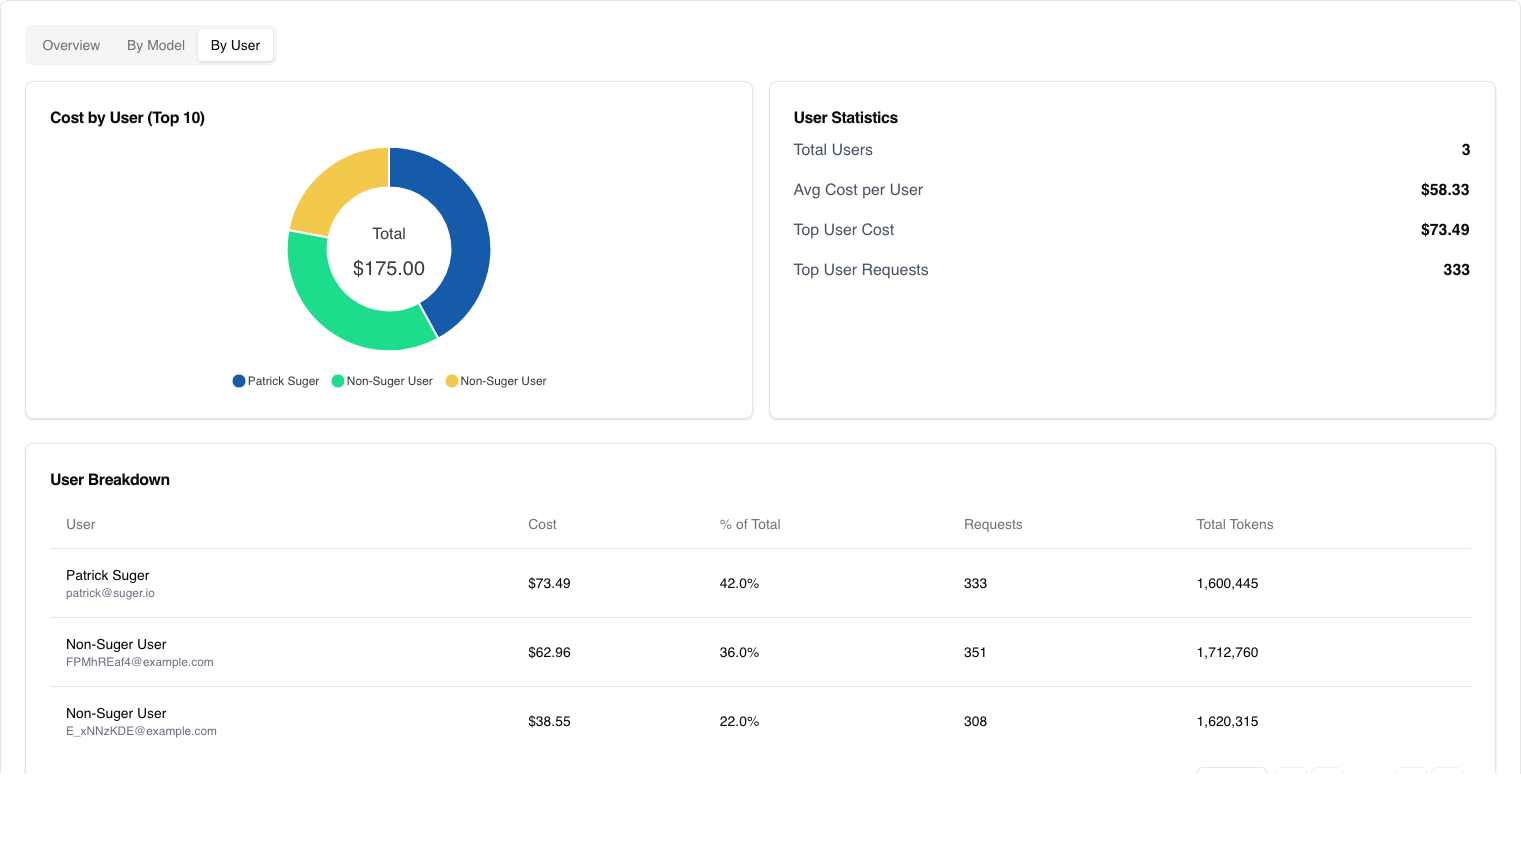
By User Tab (Admin Only)
Only visible to organization admins.
- Top Users — donut chart of cost distribution across users
- User Statistics — total users, average cost per user, top user cost and request count
- User Breakdown Table — per-user cost, percentage of total, requests, and token counts
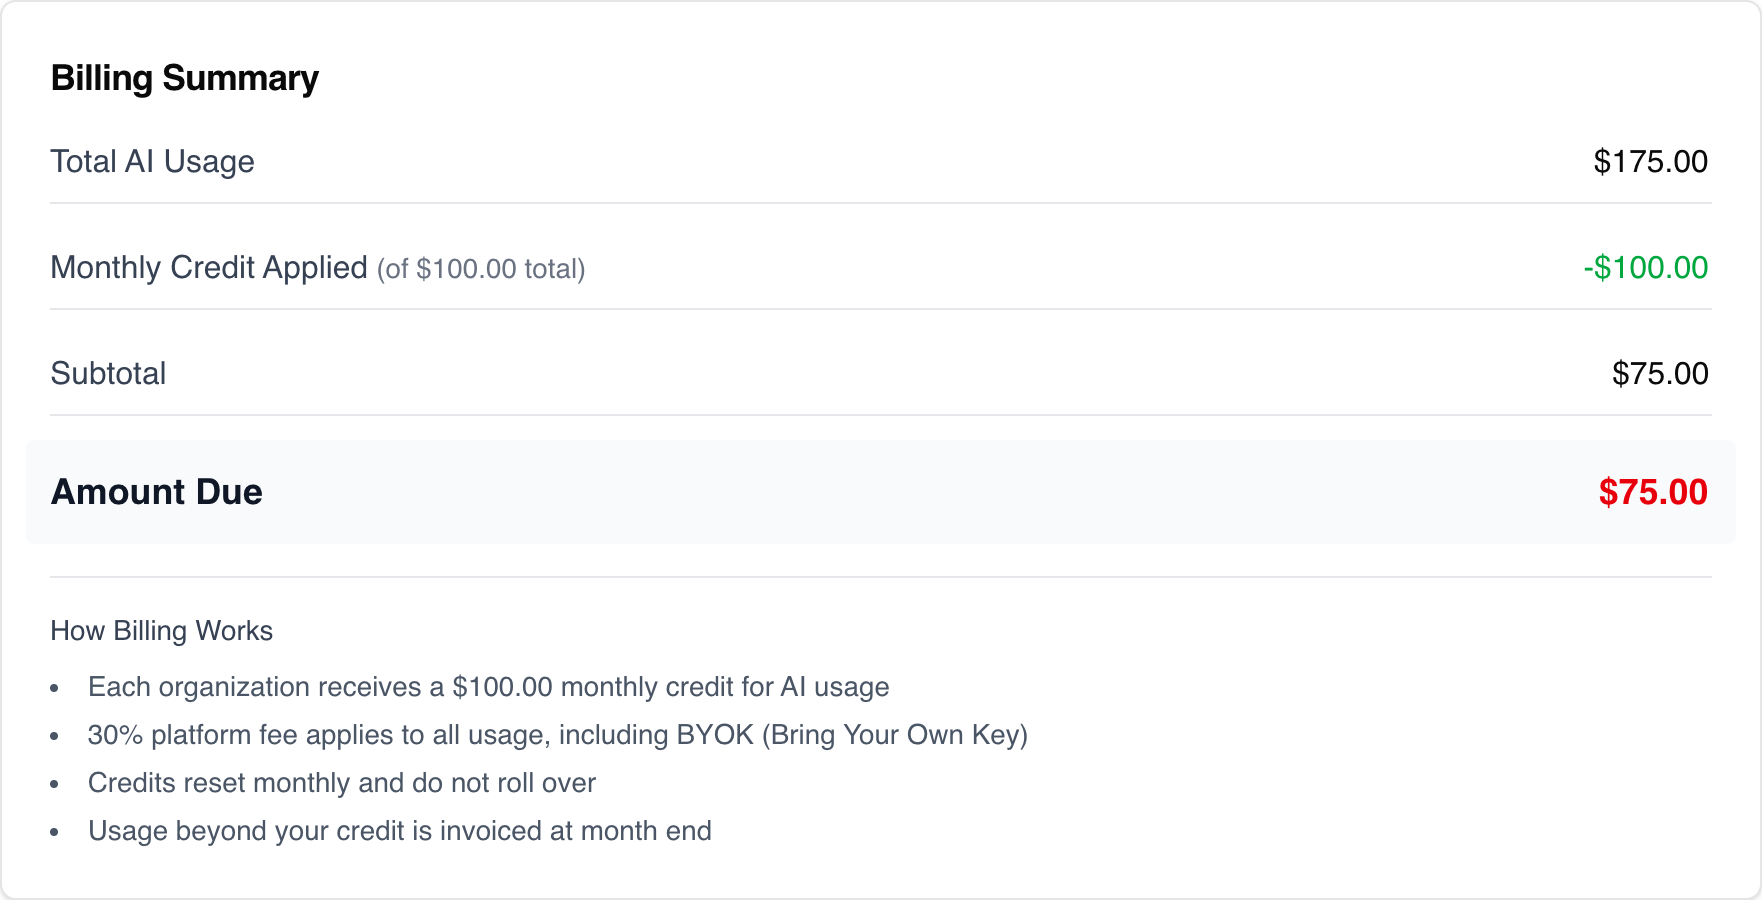
Billing Summary Card
Shown for the current month only. A receipt-style summary:
- Total AI Usage — gross cost
- Monthly Credit Applied — credit deducted (shown in green)
- Subtotal
- Amount Due — what you owe
Also includes a “How Billing Works” summary:
- $100 monthly credit included
- 30% platform fee applies to all usage (including BYOK)
- Credits reset monthly and don’t roll over
- Overage invoiced at month end
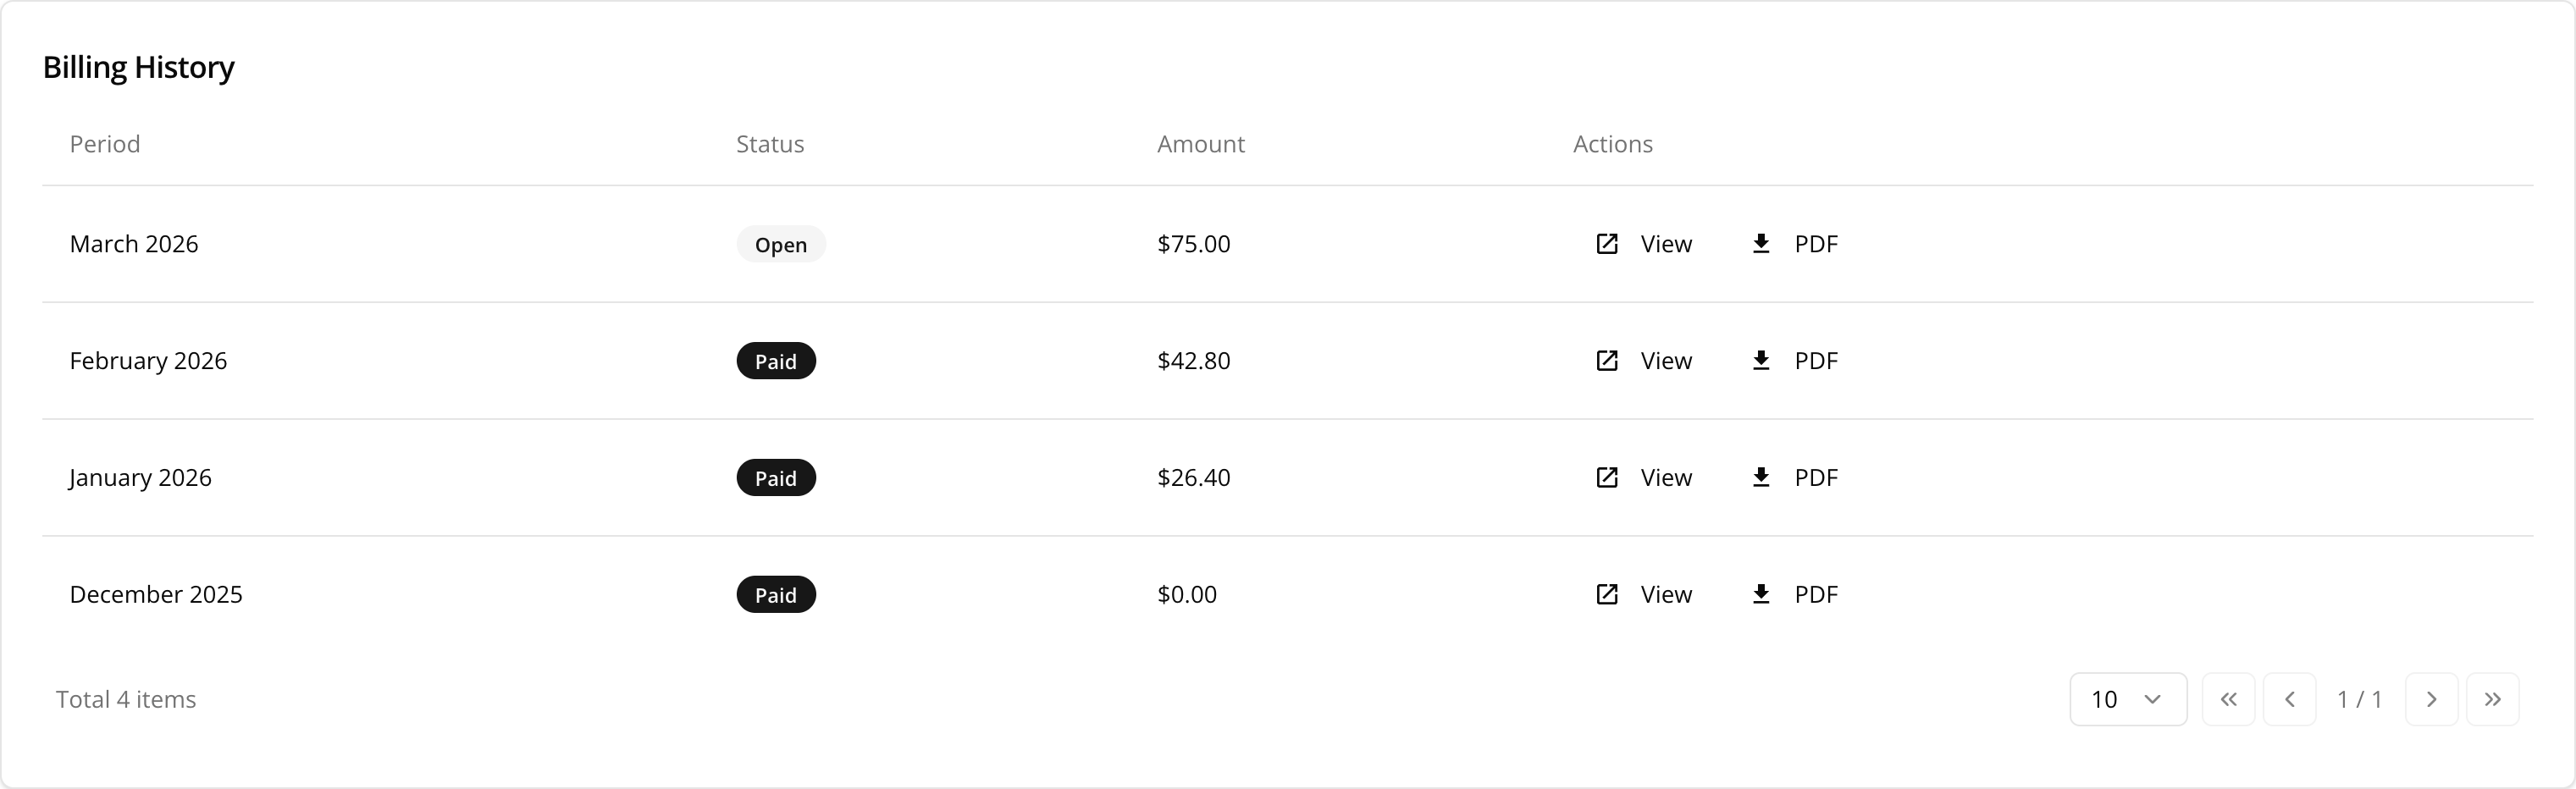
Billing History
A table showing your last 12 months of invoices:
| Column | Description |
|---|---|
| Period | Month and year of the billing period |
| Status | Invoice status (Draft, Open, Paid, Uncollectible, Void) with colored badge |
| Amount | Total amount due on the invoice |
| Actions | ”View” to open the full invoice, “PDF” to download |
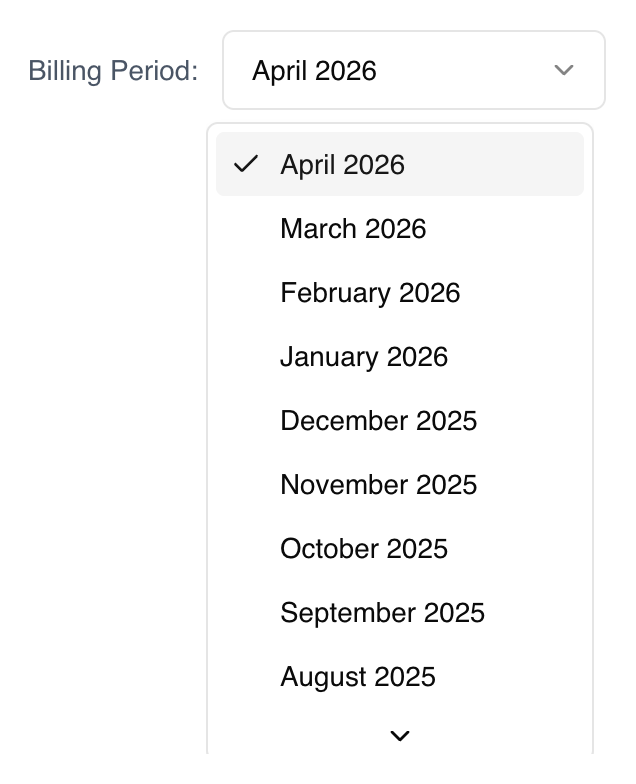
Month Selector
Use the dropdown at the top to view billing data from previous months. You can look back at the last 12 months of billing history to compare usage patterns over time.
Role Permissions
| Feature | All Members | Admins Only |
|---|---|---|
| Summary Cards | Yes | Yes |
| Usage Charts | Yes | Yes |
| Overview Tab | Yes | Yes |
| By Model Tab | Yes | Yes |
| By User Tab | No | Yes |
| Billing History | Yes | Yes |
| CSV Export | Yes | Yes |